Week 15: 27 5 May - 9 May (Reno forecast tools.)
Tuesday: Zach gives a talk on weather modeling, and the Norwegian Cyclone Model, and chaos.
Excellent job Zach! Here is the presentation, and time lapse movie.
Check out the Penn State eWALL.
Discuss the final presentations. Final meeting Friday May 8th, 7:30 a.m. to 9:30 a.m.
Each person gives a 20 minute presentation on measurements related to 23 April 09.
Week 14: 27 April - 1 May (Reno forecast tools.)
Tuesday: Richard gives a talk on balloon soundings and Skew T Log P. Excellent Iggy!
Work on data analysis from last measurements.
Data from 23 April 09:
Images
FTIR data.
Solar irradiance, total and diffuse radiation.
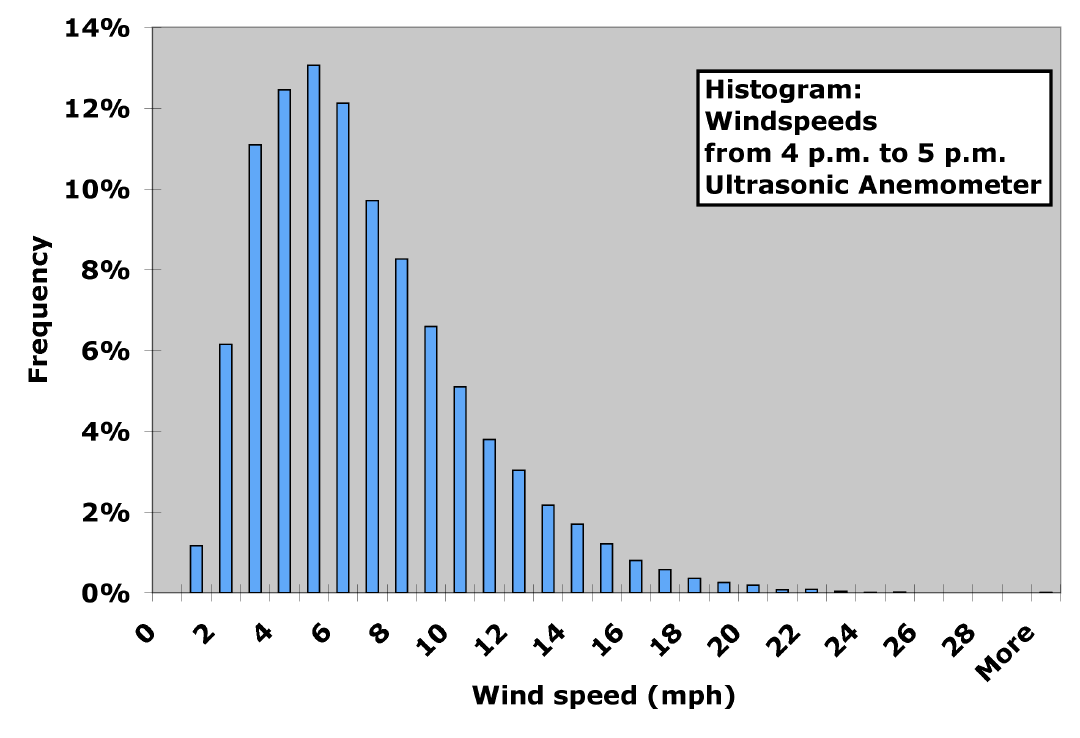
Ultrasonic Anemometer Wind Measurements.
Excellent time lapse movie of wave cloud by Zach.
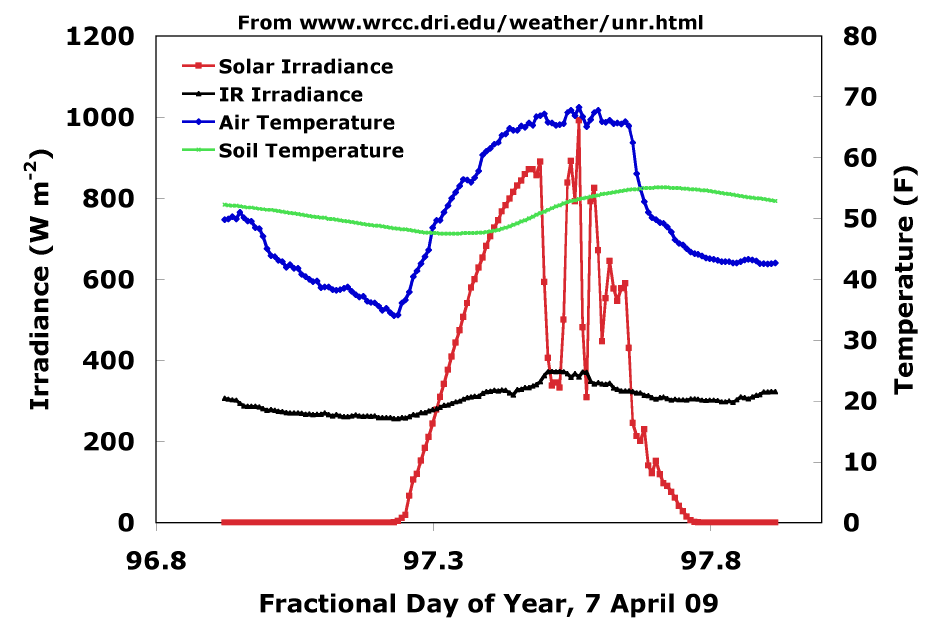
DRI weather for comparison.
Example Data (click on images for large version).
| Wind speed time series |
Wind speed histogram |
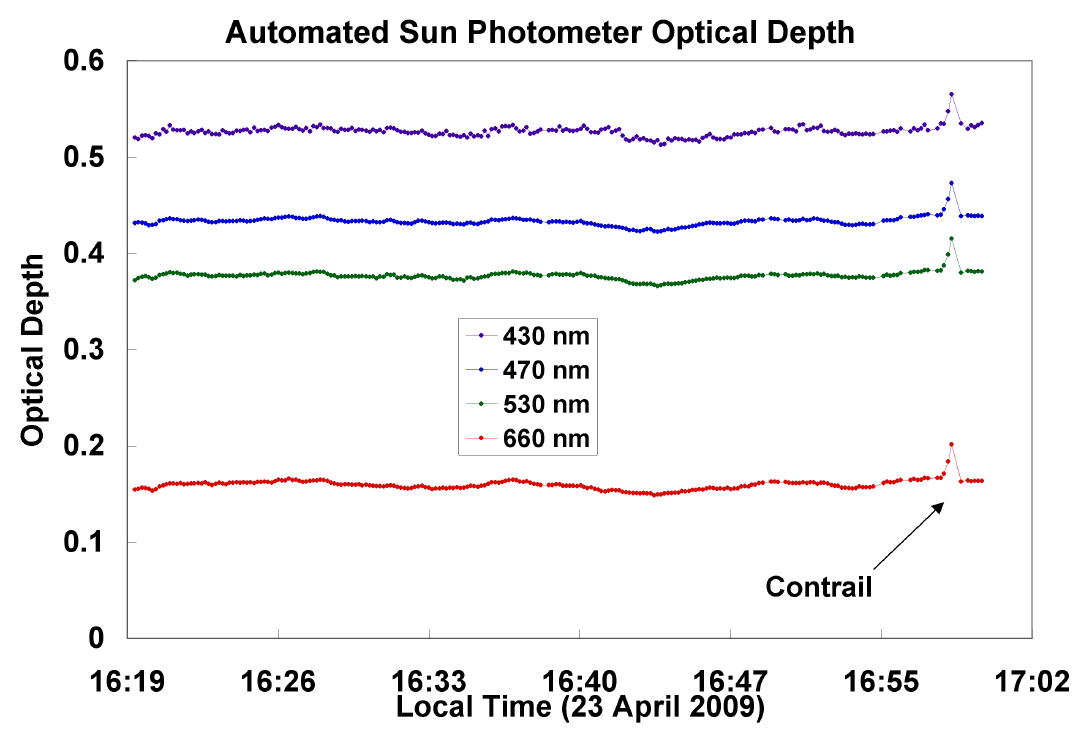
Automated Sunphotmeter Optical Depth |
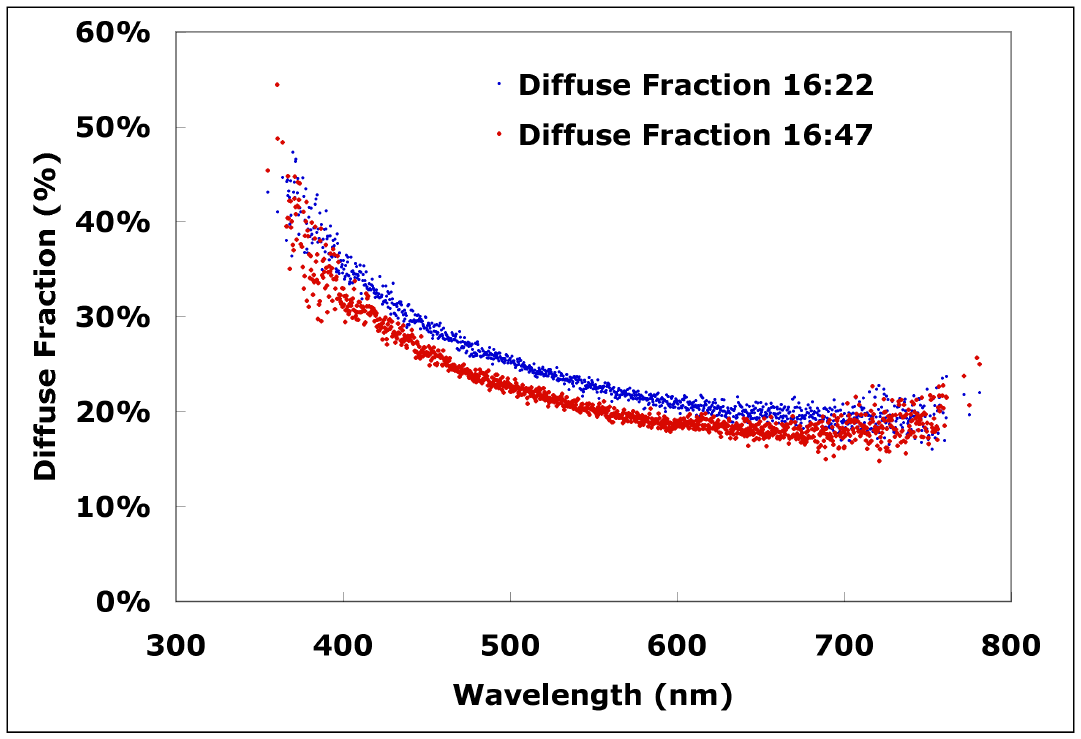
Diffuse fraction of Solar Radiation |
 |
 |
 |
 |
Very nice meteorology course to go with our discussions on fronts and the Norwegian Cyclone Model.
Cloud atlas.
We are heavily into project development now. We have the new sensors for radiance and irradiance based on LEDs, hand held sun photometers, spectral sun tracking sun photometer, standard weather station, ultrasonic weather station, and downwelling IR measured by the FTIR spectrometer, in addition to data from the local UNR weather station on Valley Road.
We will begin FTIR spectroscopy theory and measurements as well. Simple intro, and presentation.
Week 13: 20 April - 24 April (Reno forecast tools.)
THURSDAY: MEASUREMENTS!!! WE START AT 5 a.m., and continue all day.
Remember, each student must get an FTIR spectrum and interpret it.
We will have: Ultrasonic anemometer, 2 weather stations from two students, irradiance prototype, 2 sunphotometers, tracking sunphotometer, and FTIR spectrometer.
We will search out the morning inversion with the FTIR, hope for some clear skies, and some cirrus skies.
Yay!
Stephen Bone gives a talk on ultrasonic wind detection. (Nice job Stephen). Then we prepare for measurements, and go through the sun photometer use.
We will check the operation of the automated sun photometer as well.
Very nice meteorology course to go with our discussions on fronts and the Norwegian Cyclone Model.
Cloud atlas.
We are heavily into project development now. We have the new sensors for radiance and irradiance based on LEDs, hand held sun photometers, spectral sun tracking sun photometer, standard weather station, ultrasonic weather station, and downwelling IR measured by the FTIR spectrometer, in addition to data from the local UNR weather station on Valley Road.
We will begin FTIR spectroscopy theory and measurements as well. Simple intro, and presentation.
Week 12: 13 April - 20 April (Reno forecast tools.)
Very nice meteorology course to go with our discussions on fronts and the Norwegian Cyclone Model.
Cloud atlas.
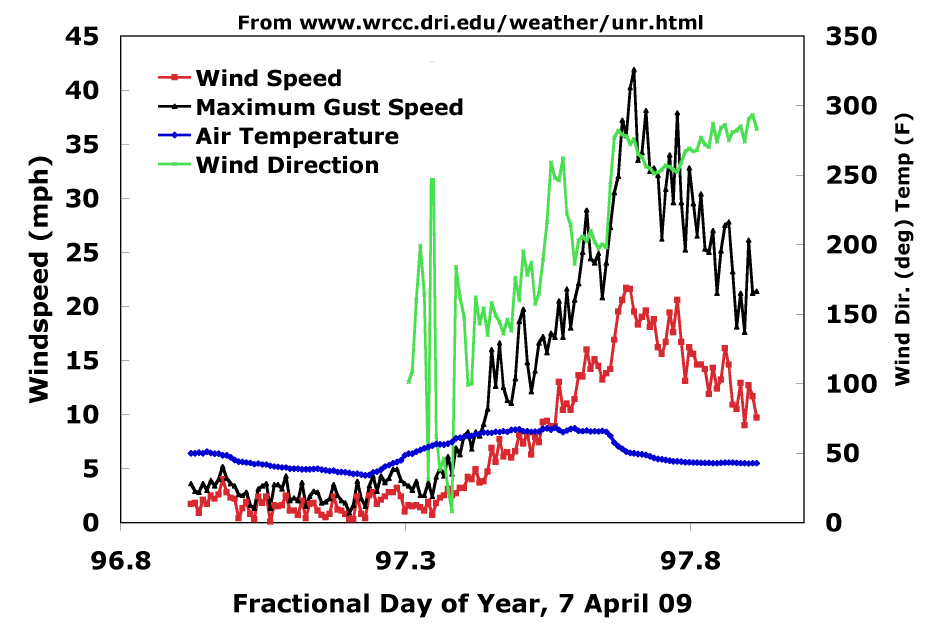
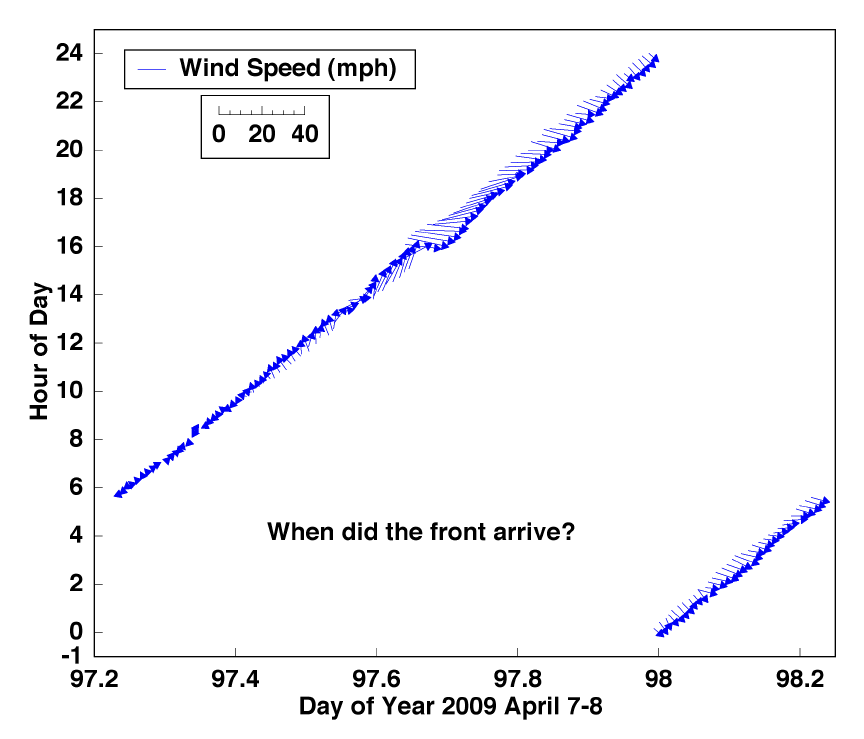
Given that we are having a frontal passage in the next 24 to 48 hours, we need an assignment to appreciate it. You can work together or in groups to evaluate the following:
1. Go to the www.wrcc.dri.edu/unr.html site and retrieve the data for wind speed, direction, RH, temperature, solar, and IR. Identify the frontal passage over the weather station. Discuss the variables that have changed and why as the front passes.
2. Get the bigger picture by satellite imagery and by surface analysis. Show the location of the low and it progression.
3. Discuss broadly with figures you get from google or your undergrad atms 117 book on the nature of the front, the vertical cross section, and the way it looks in space and time.
This must be done by Thursday. You can present one powerpoint presentation that gives all the details with each person taking a part. We will talk more about it in class tomorrow.
We are heavily into project development now. We have the new sensors for radiance and irradiance based on LEDs, hand held sun photometers, spectral sun tracking sun photometer, standard weather station, ultrasonic weather station, and downwelling IR measured by the FTIR spectrometer, in addition to data from the local UNR weather station on Valley Road.
We will begin FTIR spectroscopy theory and measurements as well. Simple intro, and presentation.
Week 11: 6 April - 10 April (Reno forecast tools.)
Marissa presents IR satellite measurements.
We are heavily into project development now. We have the new sensors for radiance and irradiance based on LEDs, hand held sun photometers, spectral sun tracking sun photometer, standard weather station, ultrasonic weather station, and downwelling IR measured by the FTIR spectrometer, in addition to data from the local UNR weather station on Valley Road.
We will begin FTIR spectroscopy theory and measurements as well. Simple intro, and presentation.
Week 10: 30 March - 3 April (Reno forecast tools.)
We are heavily into project development now. We have the new sensors for radiance and irradiance based on LEDs, hand held sun photometers, spectral sun tracking sun photometer, standard weather station, ultrasonic weather station, and downwelling IR measured by the FTIR spectrometer, in addition to data from the local UNR weather station on Valley Road.
We will begin FTIR spectroscopy theory and measurements as well. Simple intro, and presentation.
Week 9: 23-27 March (Reno forecast tools.)
Marissa will prepare the weekly weather forecast and analysis. She will also discuss GOES IR satellite imagery.
Radar Meteorology. The developed irradiance meters and radiance meters will be deployed as soon as the control hardware and software are ready.
Online radar meteorology course.
Direct approach to radar theory. Note the homework problem due Tuesday after Spring Break.
We will begin FTIR spectroscopy theory and measurements as well. Simple intro, and presentation.
Week 8: 9-14 March (Reno forecast tools.)
Zach will prepare the weekly weather forecast and analysis.
Turn in the electronic lab report by Tuesday March 10.
Radar Meteorology. The developed irradiance meters and radiance meters will be deployed as soon as the control hardware and software are ready.
Online radar meteorology course.
Direct approach to radar theory. Note the homework problem due Tuesday after Spring Break.
Week 7: 2-6 March (circuits online textbook. Reno forecast tools.)
Iggy will prepare the weekly weather forecast and analysis.
Turn in the electronic lab report by Thursday March 5.
Begin to use:
The irradiance detectors will be interfaced with ARMmite microprocessors for data acquisition, and will be tested, with their output compared to that from the UNR broadband solar detector at the weather station on Valley Road.
Sun photometer presentations and documents.
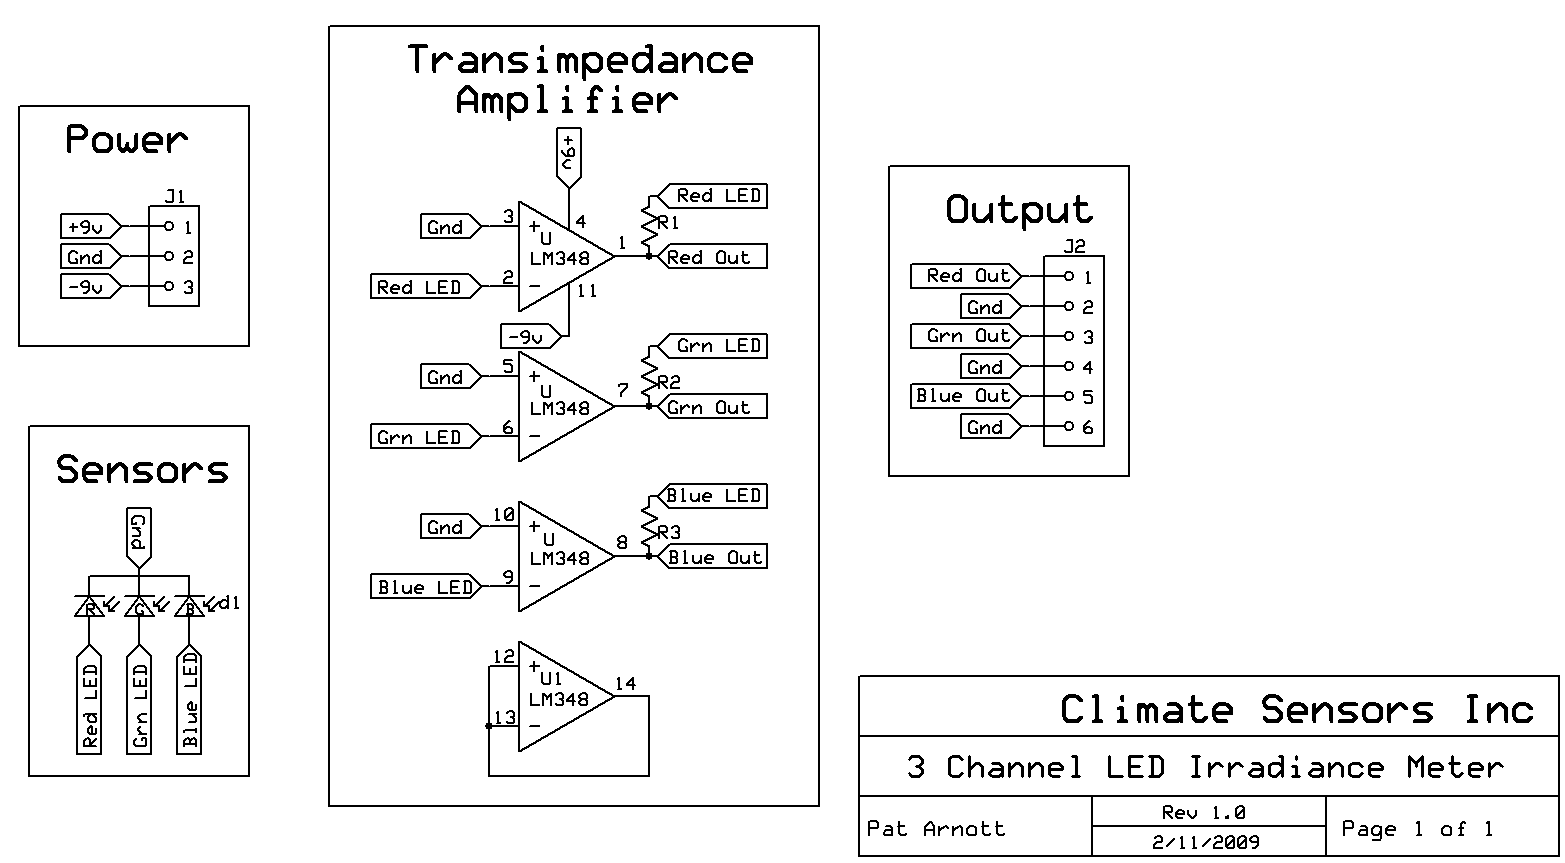
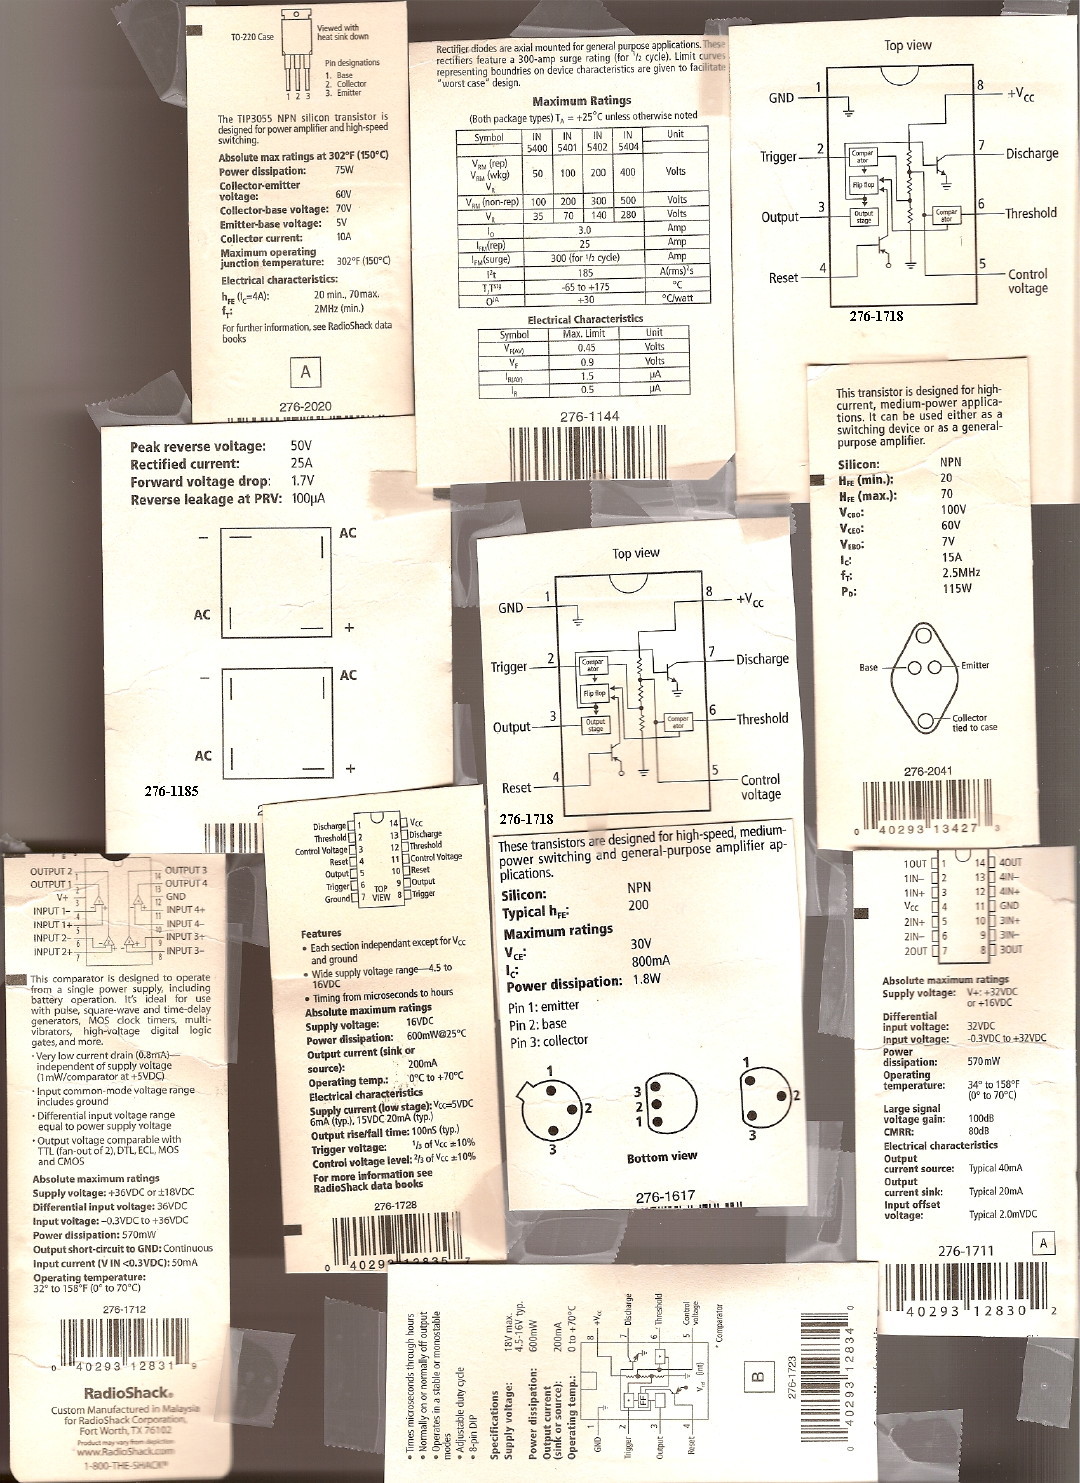
Helpful documents: Lock in circuits, Starting thoughts for the common cathode 3 LED and op amp circuit. Schematic. All components and computers will be provided.
Week 6: 16-20 February (circuits online textbook. Reno forecast tools.)
Stephen will prepare the weekly weather forecast and analysis.
Guoxon will prepare a discussion of how a lockin amplifier works.
Three groups will continue to develop the following:
a. 3 channel (Red Green Blue) irradiance detector using a 3 diode LED and 4 op amp IC, with the LED as is, 120 degree collection angle and dome.
b. Same as a., however, the LED dome will be shaved off, and the surface will be roughened to simulate lambertian conditions.
c. A bread board lock in amplifier to use with the monochrometer to measure the LED response as a function of wavelength.
d. The irradiance detectors will be interfaced with ARMmite microprocessors for data acquisition, and will be tested, with their output compared to that from the UNR broadband solar detector at the weather station on Valley Road.
Helpful documents: Lock in circuits, Starting thoughts for the common cathode 3 LED and op amp circuit. Schematic. All components and computers will be provided.
The same basic circuit was used recently in a laser power meter.
Week 5: 16-20 February (circuits online textbook. Reno forecast tools.)
Marissa will prepare the weekly weather forecast and analysis.
Look at weather data from the UNR site.
Three groups will develop the following:
a. 3 channel (Red Green Blue) irradiance detector using a 3 diode LED and 4 op amp IC, with the LED as is, 120 degree collection angle and dome.
b. Same as a., however, the LED dome will be shaved off, and the surface will be roughened to simulate lambertian conditions.
c. A bread board lock in amplifier to use with the monochrometer to measure the LED response as a function of wavelength.
d. The irradiance detectors will be interfaced with ARMmite microprocessors for data acquisition, and will be tested, with their output compared to that from the UNR broadband solar detector at the weather station on Valley Road.
Helpful documents: Lock in circuits, Starting thoughts for the common cathode 3 LED and op amp circuit. Schematic. All components and computers will be provided.
The same basic circuit was used recently in a laser power meter.
Week 4: 9-13 February (circuits online textbook)
Zach will prepare the weekly weather forecast and analysis.
Look at weather data from the UNR site.
We will continue to do a basic circuit laboratory together.
Basic operational amplifier theory.
Circuit board layout, and starting circuit .
We will begin to use the operational amplifier and sun photometer presentations and documents.
Week 3: 2-6 February (circuits online textbook)
Iggy will prepare the weekly weather forecast and analysis.
Look at Weather data from the UNR site.
Today's demo was on the ARMmite RISC computer.
Notes on LEDs.
General Solid State Device Theory.
Circuit components smörgåsbord.
Quiz.
We will continue to do a basic circuit laboratory together.
Basics of resistors.
Basic operational amplifier theory.
We will begin to use the operational amplifier and sun photometer presentations and documents.
Week 2: 26-30 January (circuits online textbook)
Stephen will prepare the weekly weather forecast and analysis.
Look at WRCC data from the UNR site.
Thoughts for the week: Tornado intensity seems to relate to rain drop size.
We will continue to do a basic circuit laboratory together.
Basics of resistors.
Basic operational amplifier theory.
Week 1: 19-23 January (circuits online textbook)
Introductions. Syllabus.
Why? Earth's radiation balance from this source.
Overview: Atmospheric Sciences relies heavily on measurements and models!
Two examples: Snow grain size study using microwave and near IR; LIDAR over Mexico City from aircraft.
We will do a basic circuit laboratory together.
Basics of resistors.
Basic operational amplifier theory.