Week 15: 4 May
Tuesday:
Chapter 5 Vorticity and Divergence.
Student Preparation:
Read chapter 5 of Martin.Quick look at rain and lightning on May 4th in Reno (afternoon).
Geostationary Lightning Mapper (compare with the Great Lakes region).
COD West true color
COD US
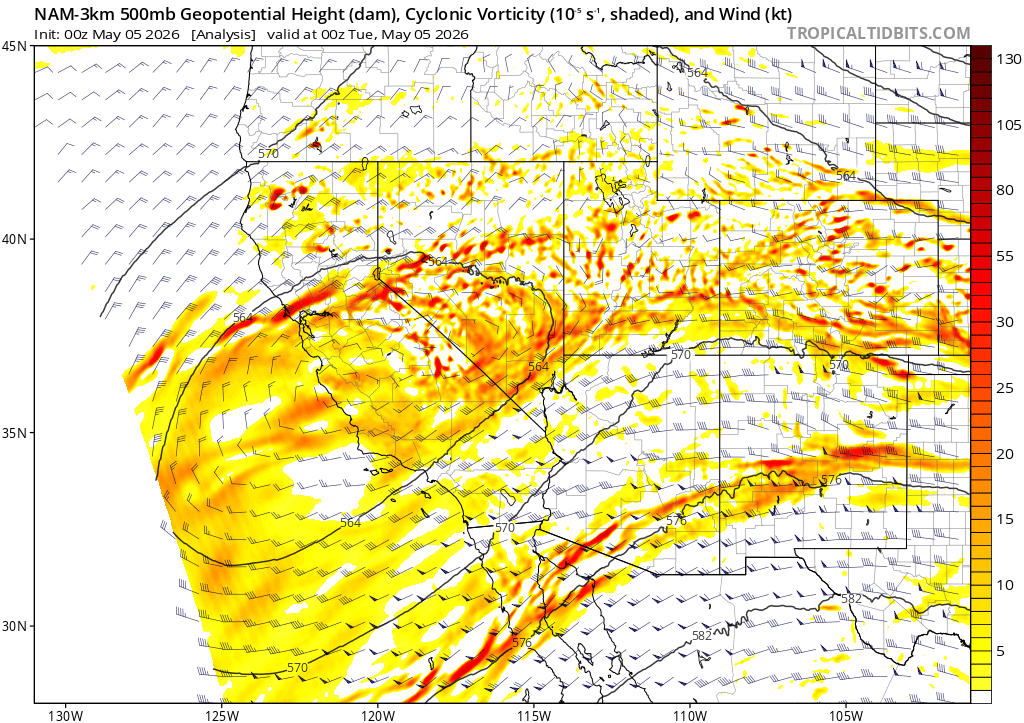
Tropical Tidbits nam3K 500mb analysis.
Week 14: 27 April
Sara presents on Tuesday; Graham on Thursday; what's happening and what will be happening with the weather in Reno and locations of your choice.
Discuss backing and/or veering conditions in the soundings and their interpretation, in addition to all of the other concepts so far.
NASA MODIS imagery from polar orbiting satellite can be very insightful. Example.
Geostationary lightning mapper and true color imagery animation.
Tuesday:
Chapter 4 notes: Applications. Continue with gradient wind discussion.
Student Preparation:
Chapter 4 of Martin. Homework assignment HW6.Next: Chapter 5 Vorticity discussion.
Week 13: 20 April
Sara presents on Tuesday; Graham on Thursday; what's happening and what will be happening with the weather in Reno and locations of your choice.
Discuss backing and/or veering conditions in the soundings and their interpretation, in addition to all of the other concepts so far.
NASA MODIS imagery from polar orbiting satellite can be very insightful. Example.
Tuesday:
Chapter 4 notes: Applications.
Student Preparation:
Read Chapter 4 of Martin. Review homework assignment HW6.
Week 12: 13 April
News Items:
https://www.sierrasun.com/news/tahoe-truckee-sees-3-5-feet-of-snow-more-weather-on-the-horizon/
Medicanes.
Sara presents on Tuesday; Graham on Thursday; what's happening and what will be happening with the weather in Reno and locations of your choice.
Discuss rain storms in the Sierras. Here's an NWS posting of GOES imagery with lightning detection for especially Saturday and Sunday April 11th and 12th.
General interface for GOES Geostationary Lightning Mapper and other GOES Imagery.
Specific Examples
Example of CONUS with lightning detection.
Full-disk clean IR.
Full-disk mid-level water vapor.
Discuss use of the lidar to obtain boundary layer height. Use April 8th and 9th as an example.
Change the height scale to 1.5-5 km. Change the backscatter scale to go from 0-0.5 NSB
Discuss the mid-term: The last problem was revised.
Lecture
Discussion of wind variation with height (local backup), backing and veering winds introduction-video.
Tuesday:Chapter 4 notes: Applications.
Student Preparation:
Read Chapter 4 of Martin. Review homework assignment HW6.
Week 11: 6 April
Sara presents on Tuesday; Graham on Thursday; what's happening and what will be happening with the weather in Reno and locations of your choice.
Discussion of wind variation with height (local backup), backing and veering winds introduction-video.
Discuss, and use in addition to our current list:
NEWEST:
a. In general, present images and animations of Tropical Tidbits and Pivotal Weather graphics to show the past, present, and future forecasts.
b. Discuss the 700 mb temperature, wind, temperature advection, and frontogenesis.
c. Northern hemisphere view and interpretation of the 500 mb level and 500 mb height anomaly.
OLDER:
e. Look more broadly at the PurpleAir map for Reno and Sparks to see if PM is higher in the eastern part of the valley. Example.
f. Find and use maps and/or tables of temperature records, stream flow, hydrological forecasts for dams and rivers, for example along the Colorado River.
Perhaps check with Alex to get ideas, related to his presentation at the MaCC meeting on 3/19/2026.g. Fairbanks, Alaska cold winter information.
Tuesday:Chapter 4 notes: Applications.
Student Preparation:
Read Chapter 3 of Martin. Review homework assignment HW5.
Week 10: 30 March
Sara presents on Tuesday; Graham on Thursday; what's happening and what will be happening with the weather in Reno and locations of your choice.
Discussion of wind variation with height (local backup), backing and veering winds introduction-video.
Discuss, and use in addition to our current list:
a. Look more broadly at the PurpleAir map for Reno and Sparks to see if PM is higher in the eastern part of the valley. Example.
b. Find and use maps and/or tables of temperature records, stream flow, hydrological forecasts for dams and rivers, for example along the Colorado River.
Perhaps check with Alex to get ideas, related to his presentation at the MaCC meeting on 3/19/2026.
Tuesday:Student Preparation:
Read Chapter 3 of Martin. Review homework assignment HW5.
Week 9: 16 March
Sara presents on Tuesday; Graham on Thursday; what's happening and what will be happening with the weather in Reno and locations of your choice.
Discussion of wind variation with height (local backup), backing and veering winds introduction-video.
Discuss, and use in addition to our current list:
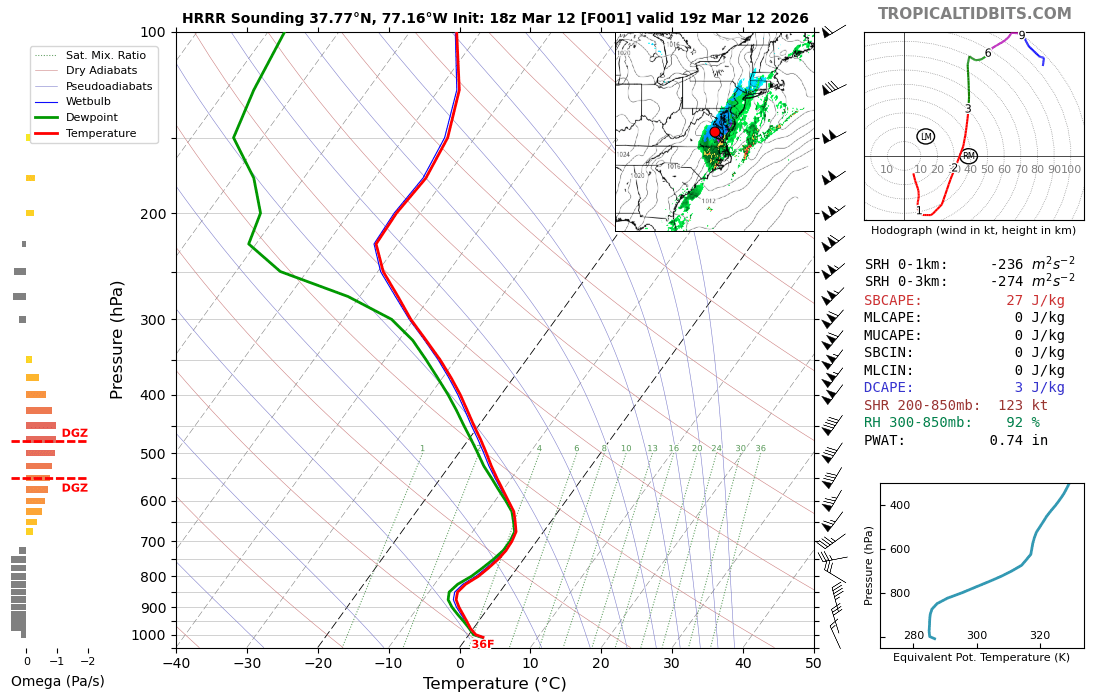
a. High-resolution-model soundings for various locations (example) by clicking at points on the model output. Discuss the usual, in addition to Omega, and DGZ, and the wind shear from near the surface to 500 mb.
b. Obtain and interpret vertical cross sections by 'control-drag' (example).
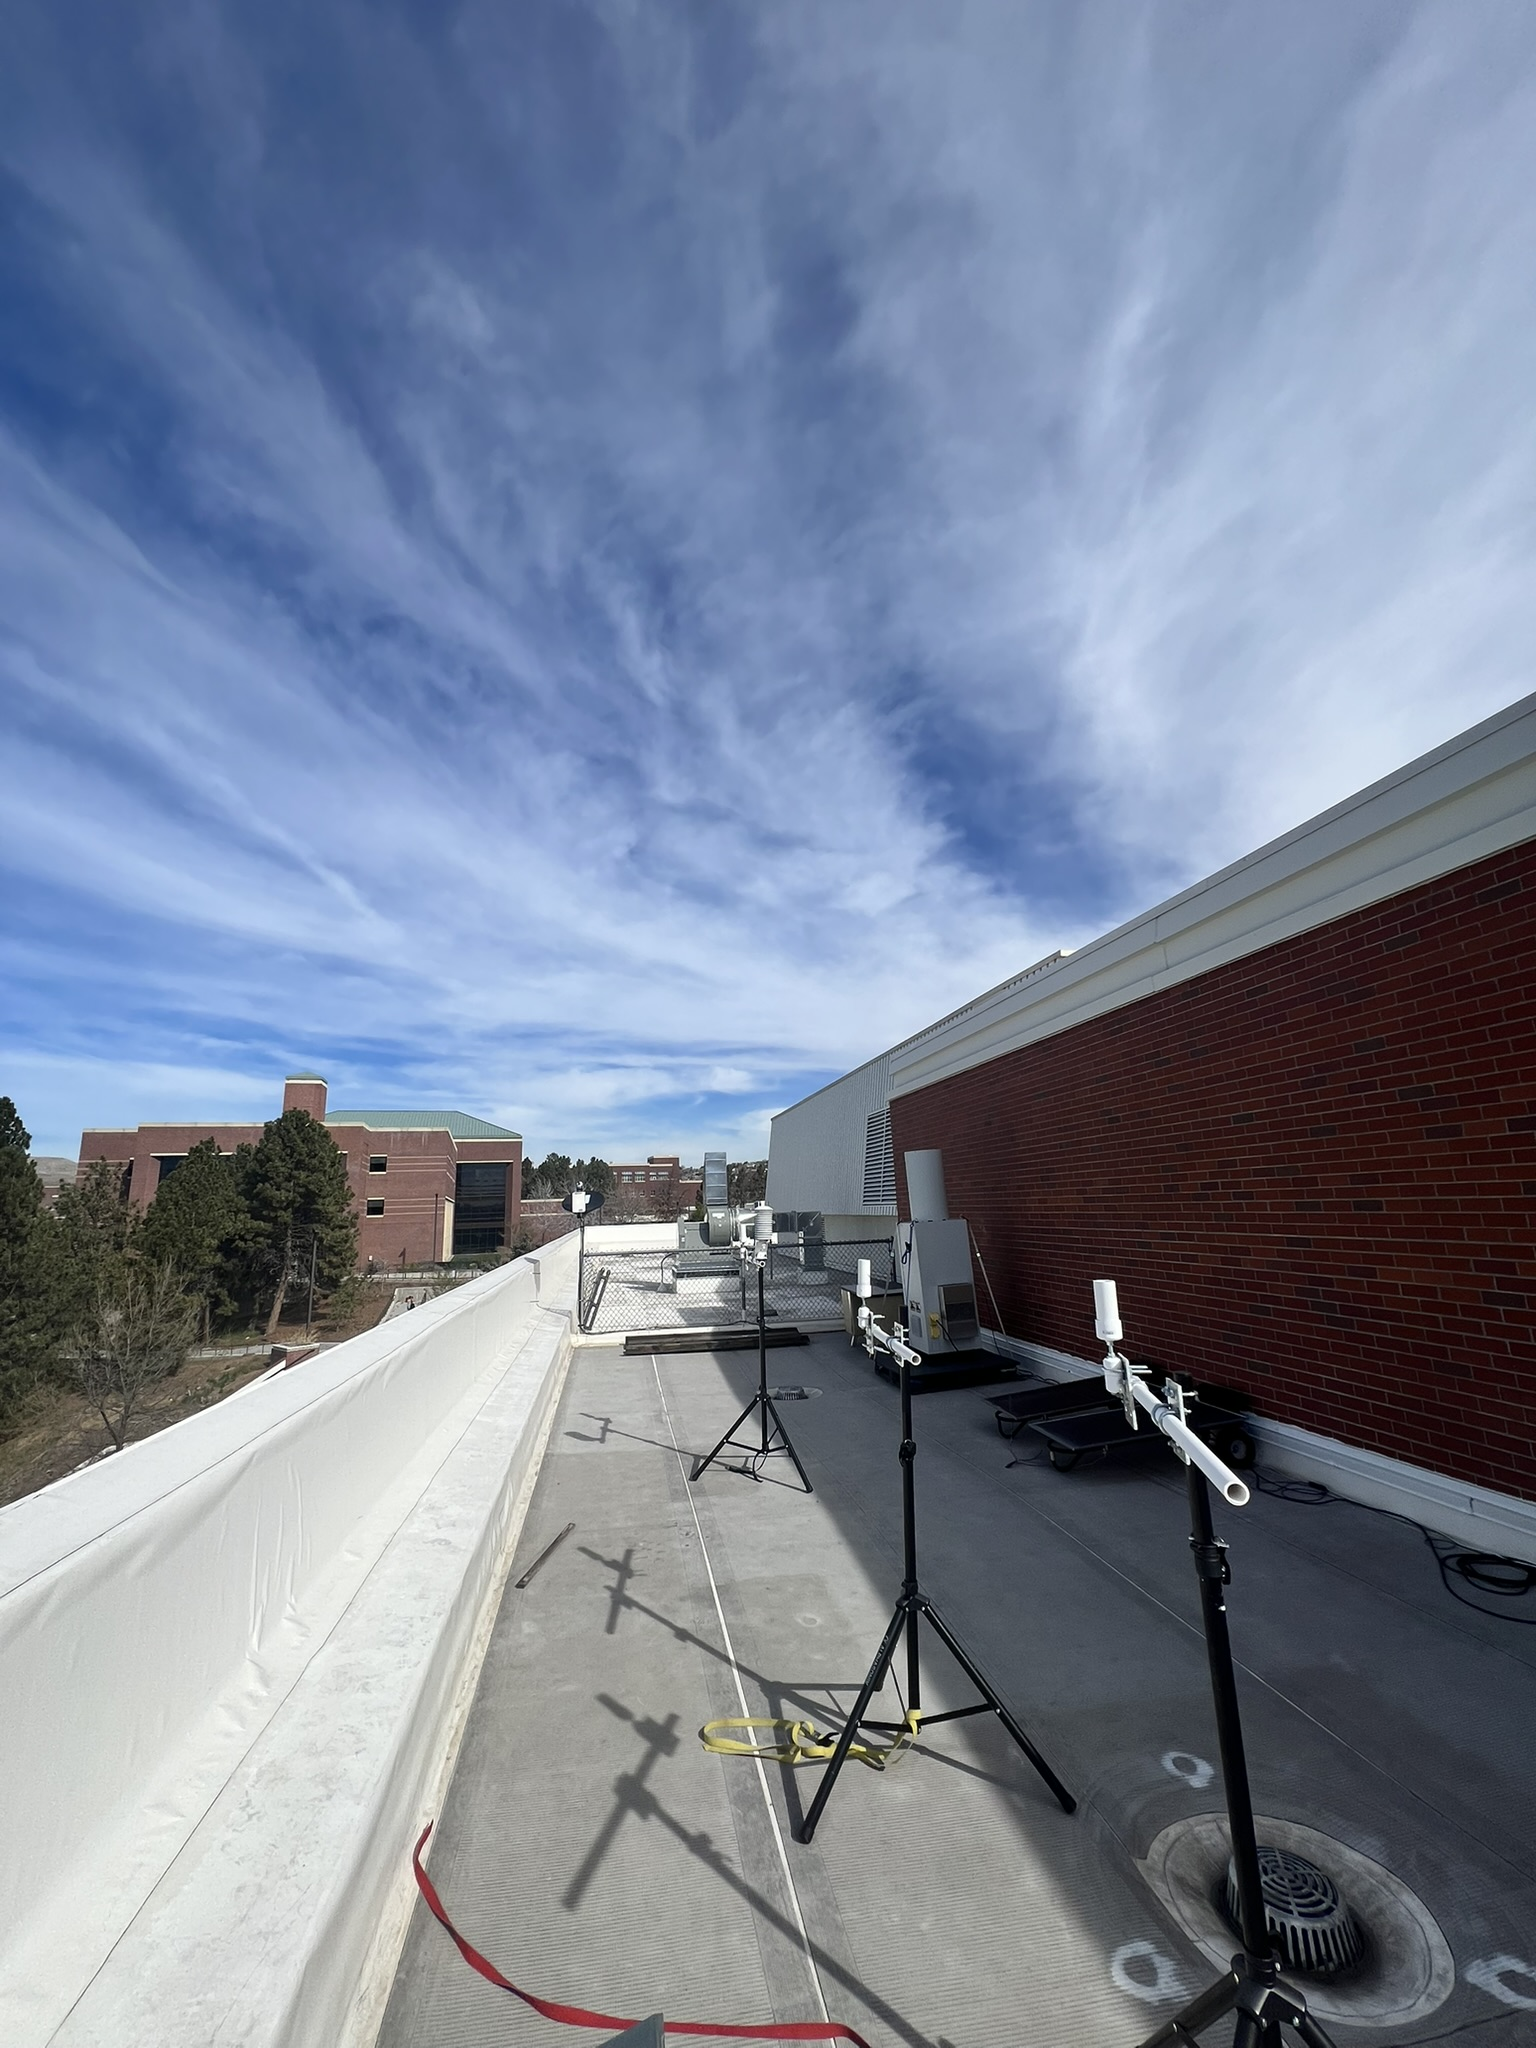
c. UNR lidar for aerosol and cloud observations above the Physics building. Choose the day.
Tuesday:Student Preparation:
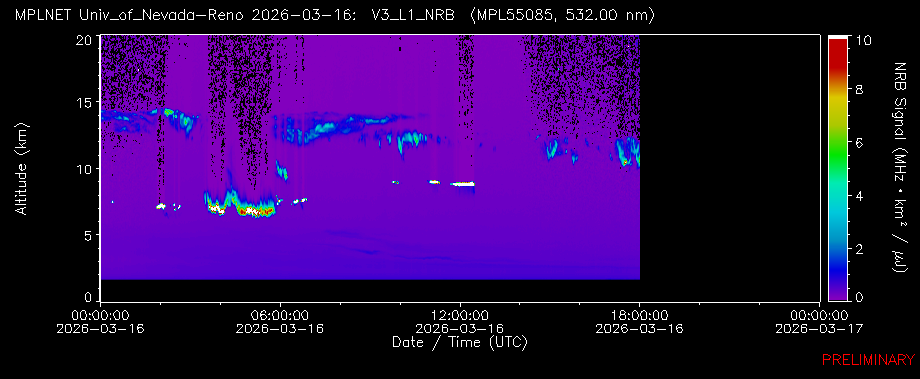
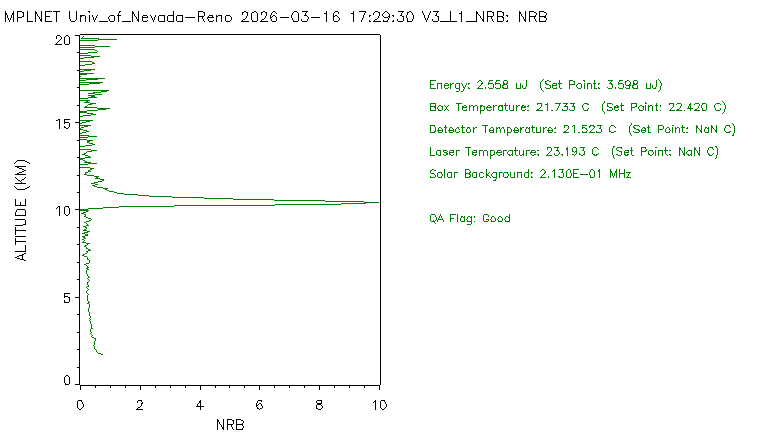
Read Chapter 3 of Martin. Review homework assignment HW4.LIDAR Example: Look at upper 20260316_12z sounding (see especially close to the tropopause) and clouds observed at 16z.
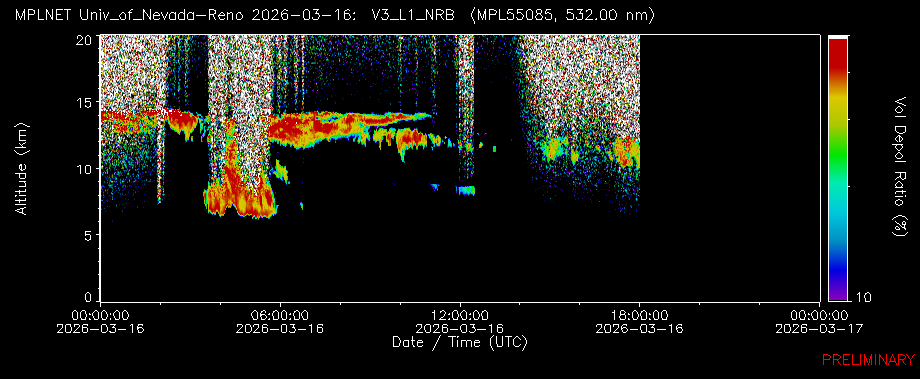
UNR Lidar data shows cloud height and laser pulse for close to 16z. Degree of depolariation related to the shape of aerosols, cloud droplets, and ice crystals.
Potential vorticity and trough on the lee side of the Rocky Mountains. Rossby waves and extreme weather. Sudden stratospheric warming. |
Week 8: 9 March
Sara presents on Tuesday; Graham on Thursday; what's happening and what will be happening with the weather in Reno and a location of your choice.
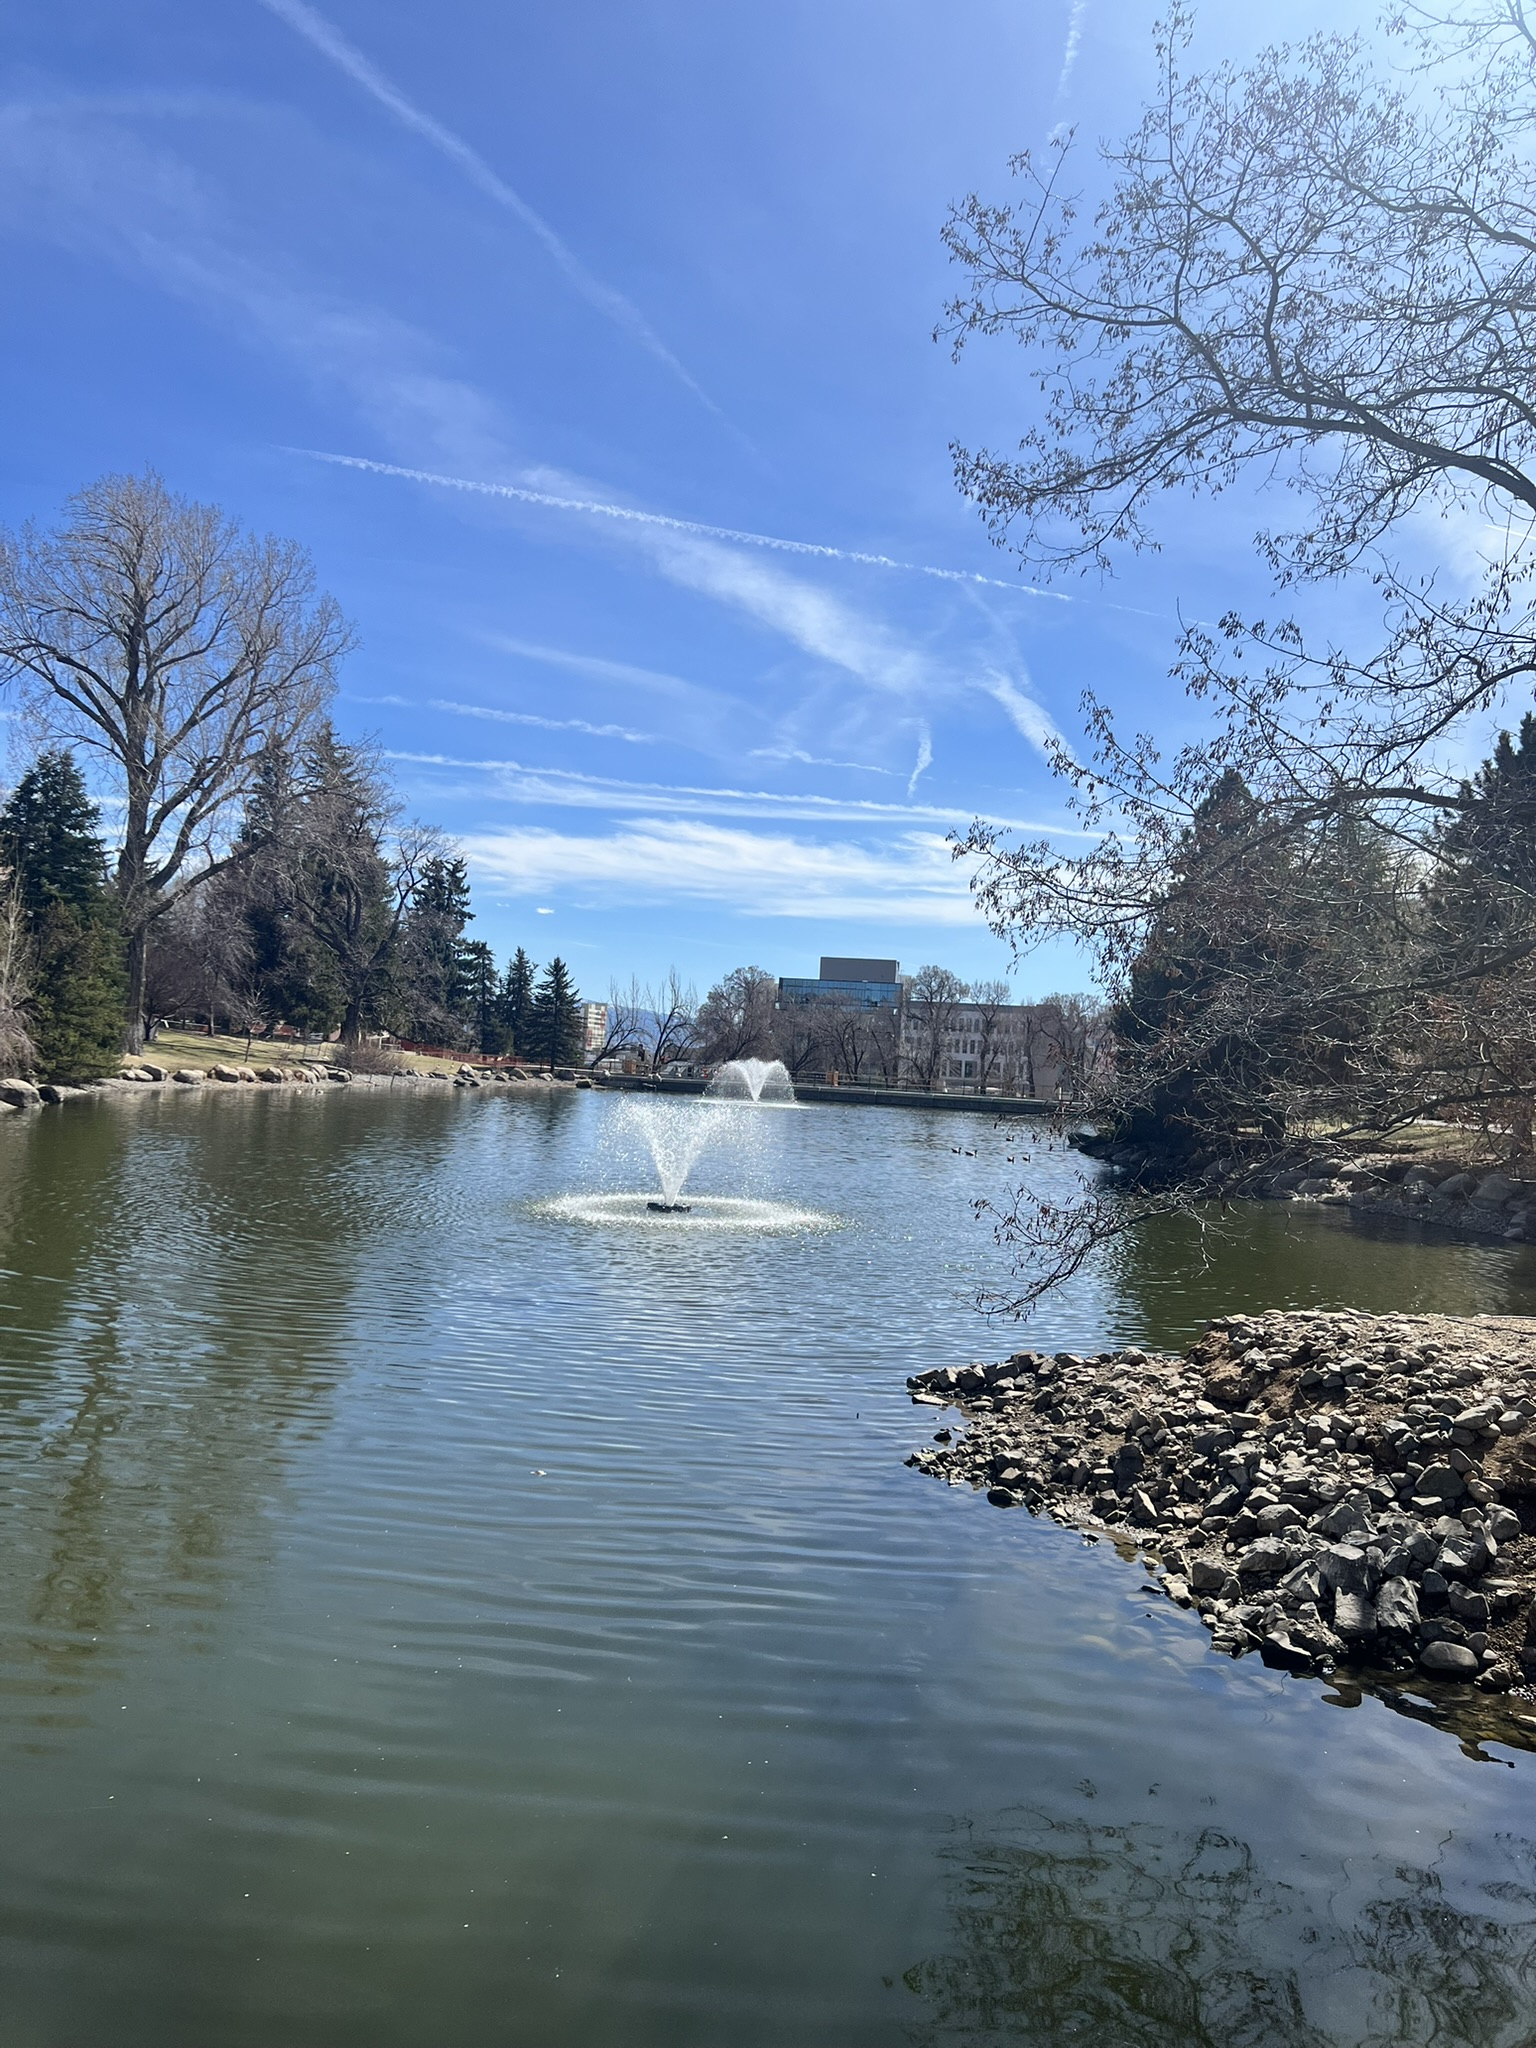
Prolific contrails on Monday 3/9/2026. Discuss soundings and upper level water vapor.
Previous and Forecast Weather Discussion Additions:
Calculate and display 2 separate backtrajectories for 10 days (GFS model) for Reno, and use 2 heights:
100 m (near surface); and 4000 m AGL (approximate 500 mb level).
Choose a convenient time (UTC) for your trajectories.Discuss use:
Surface analysis example from recent tornado outbreaks in Oklahoma.Weather Prediction Center weather discussion.
Storm Prediction Center surface vorticity and divergence.
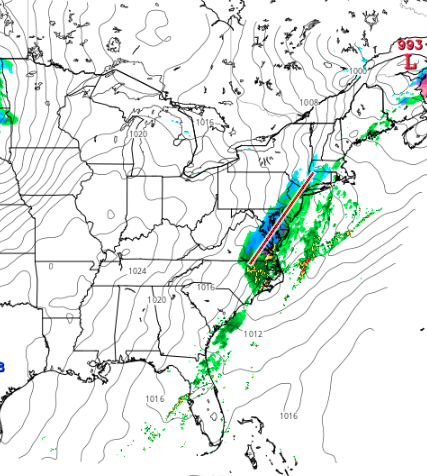
High resolution precipitation forecast HRRR model (Tropical Tidbits).
700 mb temperature advection, wind, and frontogenesis.
Mean sea level pressure and winds (CONUS, Southwest). Note the relationship between isobars and wind speed and direction.
Thursday:Tuesday:
Student Preparation:
Read Chapter 2 of Martin. Review homework assignment HW3.
Short Videos For Chapter 2 Sudden stratospheric warming.
Rossby waves and extreme weather.
Week 7: 2 March
Sara presents on Tuesday; Graham on Thursday; what's happening and what will be happening with the weather in Reno and a location of your choice.
Previous and Forecast Weather Discussion Additions:
Calculate and display 2 separate backtrajectories for 10 days (GFS model) for Reno, and use 2 heights:
100 m (near surface); and 4000 m AGL (approximate 500 mb level).
Choose a convenient time (UTC) for your trajectories.Discuss and start using:
700 mb temperature advection, wind, and frontogenesis.
GEFS Ensemble Forecast:
Tuesday:Student Preparation:
Read Chapter 2 of Martin. Review homework assignment HW3.
Short Videos For Chapter 2 Sudden stratospheric warming.
Rossby waves and extreme weather.
Week 6: 23 February
Sara presents on Tuesday; Graham on Thursday; what's happening and what will be happening with the weather.
Forecast Additions:
2 meter temperature anomaly CONUS.
Total accumulated precip CONUS.
Mean sea level anomaly CONUS.
500 mb vorticity CONUS.
Simulated radar forecast CONUS.
Tuesday:Student Preparation:
Read Chapter 1 of Martin. Review homework assignment HW2.Notes we'll use in class.
Weeks 4 and 5: 9 and 16 February
Sara presents on Tuesday; Graham on Thursday; what's happening and what will be happening with the weather.
Tuesday and Thursday:
Student Preparation:
Read Chapter 1 of Martin. Review homework assignment HW2.Notes we'll use in class.
Related Topics:
Reno experienced a dry socket of this low pressure system.
Study the 'air mass' satellite product. View imagery and look up description (click on the question mark and follow links to discussion).
Madden-Julian oscillation: Affects large scale weather.
Forecast discussions:
Continue work together to make and evaluate weather presentations.
What's been happening:
1. Starting point, UNR Weather station data for the last 7 days.2. Air pollution measurements from the Purple Air network
3. Reno atmospheric soundings.
4. Satellite imagery showing clouds at all levels.
5. Clean IR satellite imagery to highlight high clouds.
6. Midlevel satellite water vapor channel Northern hemisphere west.
7. Surface map with highs and lows.
8. North America 2m above ground level temperature (beautiful imagery).
9. North America 2m above ground level dew point North America.
10. North America Mean sea level and 2 meter wind speed.
11. Earth Winds forecast and archive meteorology.
What's going to be happening:
1. Tropopause height in the Northern hemisphere from the potential vorticity = 2 PVU imagery.
2. 500 mb height and sea level pressure in the Northern hemisphere.
3. 500 mb height and vorticity in the continental US.
4. Southwest US, including Reno, surface pressure and precipitation types.
5. Earth winds close up view. Note also forecast capability.
6. National weather service discussion of Reno. See forecast discussion and meteograms.
Week 3: 2 February Sara presents on Tuesday; Graham on Thursday.
Thursday:
Student Preparation: Make a diagram describing relative humidity, its diurnal variation, and absolute humidity.
Discussions in class:
Continue work together to make a basic weather presentation.
Tuesday:
Student Preparation: Review the meteorological links below and bring questions to class.
Discussions in class:
Continue work together to make a basic weather presentation.
What's going to be happening:
1. Tropopause height in the Northern hemisphere from the potential vorticity = 2 PVU imagery.
2. 500 mb height and sea level pressure in the Northern hemisphere.
3. 500 mb height and vorticity in the continental US.
4. Southwest US, including Reno, surface pressure and precipitation types.
5. Earth winds close up view. Note also forecast capability.
6. National weather service discussion of Reno. See forecast discussion and meteograms.
What's been happening:
1. Starting point, UNR Weather station data for the last 7 days.2. Air pollution measurements from the Purple Air network
3. Reno atmospheric soundings.
4. Satellite imagery showing clouds at all levels.
5. Clean IR satellite imagery to highlight high clouds.
6. Midlevel satellite water vapor channel Northern hemisphere west.
7. Surface map with highs and lows.
8. North America 2m above ground level temperature (beautiful imagery).
9. North America 2m above ground level dew point North America.
Week 2: 26 January Sara presents on Tuesday; Graham on Thursday.
Tuesday and Thursday:
Student Preparation: Watch this video and bring questions to class. Temperature inversions in general and subsident inversions.
Discussions in class:
Continue work together to make a basic weather presentation.
What's going to be happening:
1. Tropopause height in the Northern hemisphere from the potential vorticity = 2 PVU imagery.
2. 500 mb height and sea level pressure in the Northern hemisphere.
3. Southwest US, including Reno, surface pressure and precipitation types.
4. Earth winds close up view. Note also forecast capability.
5. National weather service discussion of Reno. See forecast discussion and meteograms.
What's been happening:
1. Starting point, UNR Weather station data for the last 7 days.2. Air pollution measurements from the Purple Air network
3. Reno atmospheric soundings.
4. Satellite imagery showing clouds at all levels.
5. Clean IR satellite imagery to highlight high clouds.
6. Midlevel satellite water vapor channel Northern hemisphere west.
7. Surface map with highs and lows.
8. North America 2m above ground level temperature (beautiful imagery).
9. North America 2m above ground level dew point North America.
10. North America Mean sea level and 2 meter wind speed.
11. Earth Winds forecast and archive meteorology.
Week 1: 19 January
Thursday:
Student Preparation: Review atmospheric pressure and wind (video).
Temperature inversions in general and subsident inversions.
Discussions in class:
Presentation for fronts and air masses in preparation for assignment 1.
Find an example of surface pressure forecast data.
Tuesday:
Student Preparation: Review atmospheric pressure and wind (video).
Places to learn about what is going on in this class:
Daily Notes (here)
Homework
Discussion/how-to on forecasts (see Related information for examples)
Webcampus
Introductions:
Name and major, and goals for this class.
Syllabus.Discussions in class:
Presentation for fronts and air masses in preparation for assignment 1.
Find an example of surface pressure forecast data.
Work together to make a basic weather presentation.
e.g. starting point, UNR Weather station data for the last 7 days.
Jetstream: The National Weather Service online weather school.
Matrix of topics.