ATMS 360 Homework and Course Deliverables (return to main page)
[How to write lab report]
Add an assignment of geostationary satellite remote sensing: find example of severe weather (IR), smoke plumes (visible wavelengths), fire hot spots, retrieval of atmospheric properties, lenticular cloud assignment from ATMS 411/611.
Add an assignment to use NASA Worldview to look at case studies.
Add a radar assignment to find tornados and derechos and to discuss the case. Use NOAA weather and climate toolkit. Loop the data. El Reno Tornado. Sacramento/Central Valley tornado November 8th 2022.
Use the radar to depolarization to get the radar bright band. Need to find the theory used to obtain all of the level 3 radar products.
Pressure sensor tests:
1. Acceleration response?
2. Variability by having everyone measure at the same time for some time period, and compare results.
Assignment for after spring break: (SEE IF GEOStationary Satellite data is readily available for making their own satellite loop).
Assignment 10 Purple Air low cost air quality sensors for PM2.5,
and atmospheric pressure measurements: Application to the indoor versus outdoor
air quality in the Physics building, pressure perturbations from the Tongan volcanic eruption, and measurements around the world. And possibly get data from UNR/DRI sites to study inversion days, PM level on inverted and clean days.
NOTE: PYTHON CODE IS NOW NEEDED TO VIEW GET THE PURPLE AIR DATA: HERE's ONE WITH GRAPHICS AS WELL.
ADJUST THE ASSIGNMENT TO INCLUDE GETTING THE DATA FROM PYTHON.
Prerecorded Lectures For This Assignment:
1. Introduction to this assignment, 21 March 2022 class lecture. Local backup.
2. Acquiring PurpleAir network data for January 2022 inside and outside of the Physics building, 23 March 2022 class lecture. Local backup.
3. Working with the Purple Air data to look at indoor versus outdoor air pollution, 25 March 2022 class lecture. Local backup.
Goals:
Become familiar with low cost air quality sensors and the 'internet of things' approach to measuring air quality.
Learn about the power of world wide measurement networks to observe atmospheric phenomena.
Learn about how to evaluate pressure measurements using two sensors at different elevations.
Learn about the Tongan volcanic eruption.
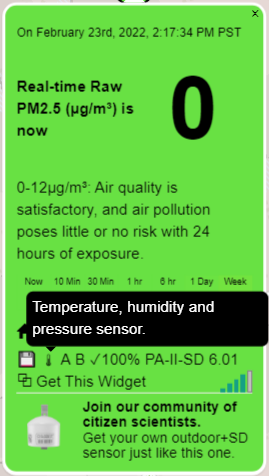
Introduction to the PurpleAir and PMS5003 aerosol sensor. (Note: The PurpleAir probably started out as an Arduino project like we've worked in class.)
Introducing the PurpleAir network for world wide air quality measurements. Zoom out to see the worldwide locations for air quality measurements.
Technology used in the PurpleAir.
The BME280 sensor data sheet and breakout board used in the PurpleAir for pressure, temperature, and relative humidity measurements.
Discussion of the Purple Air and its PMS5003 sensors, with references.
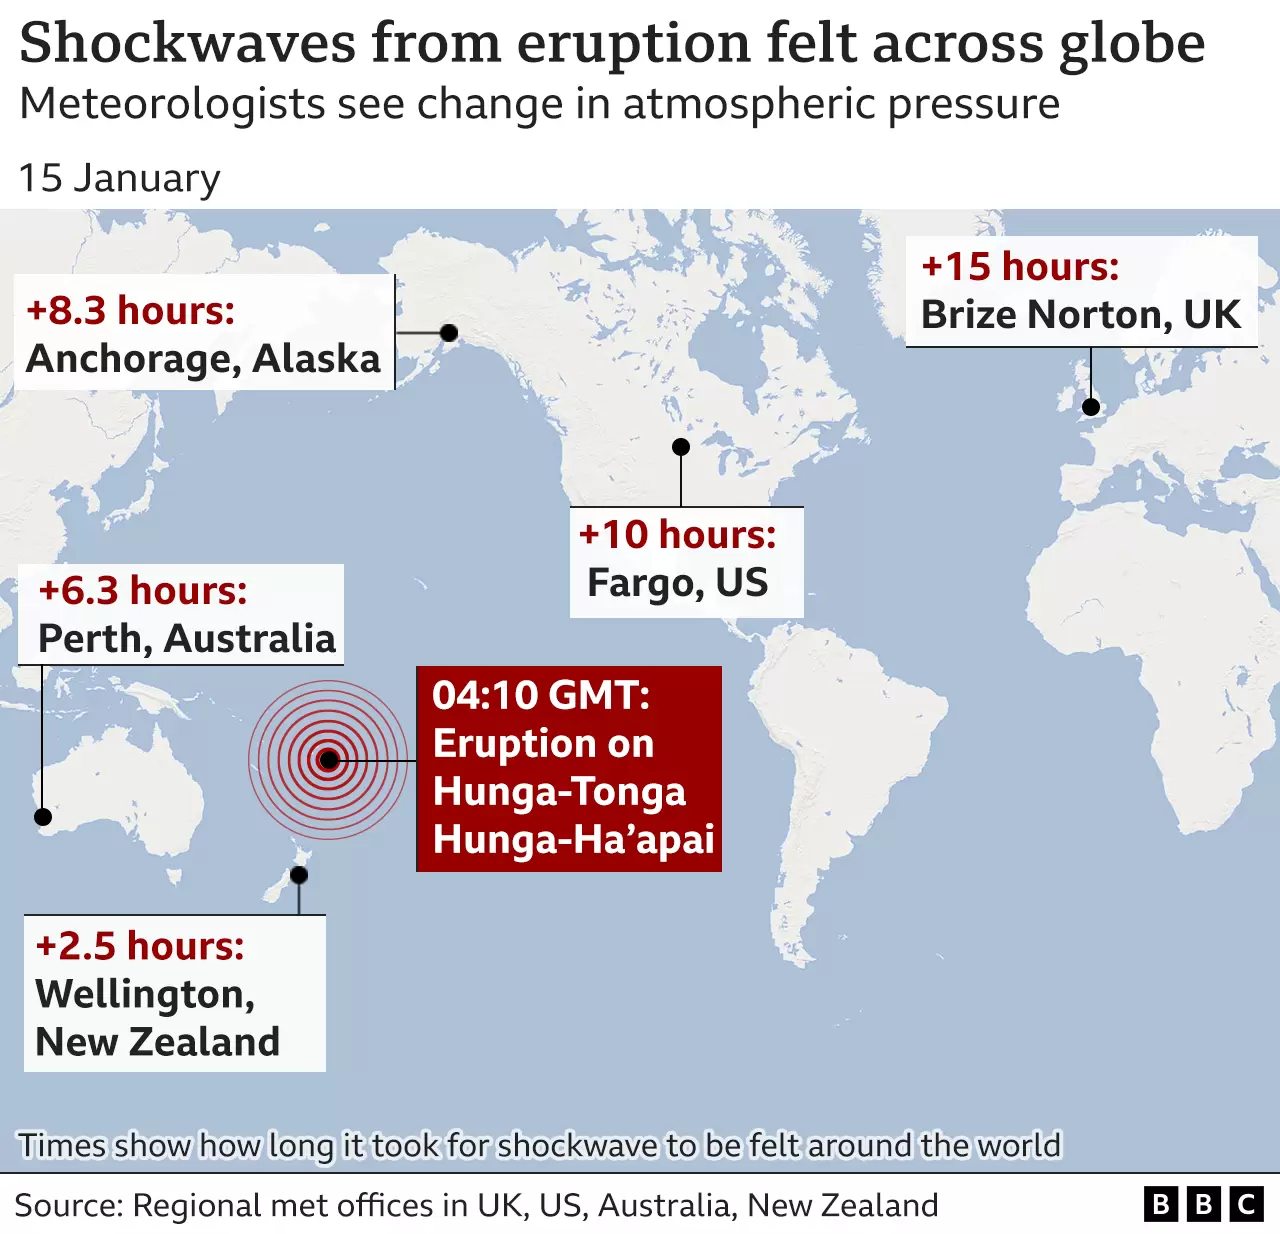
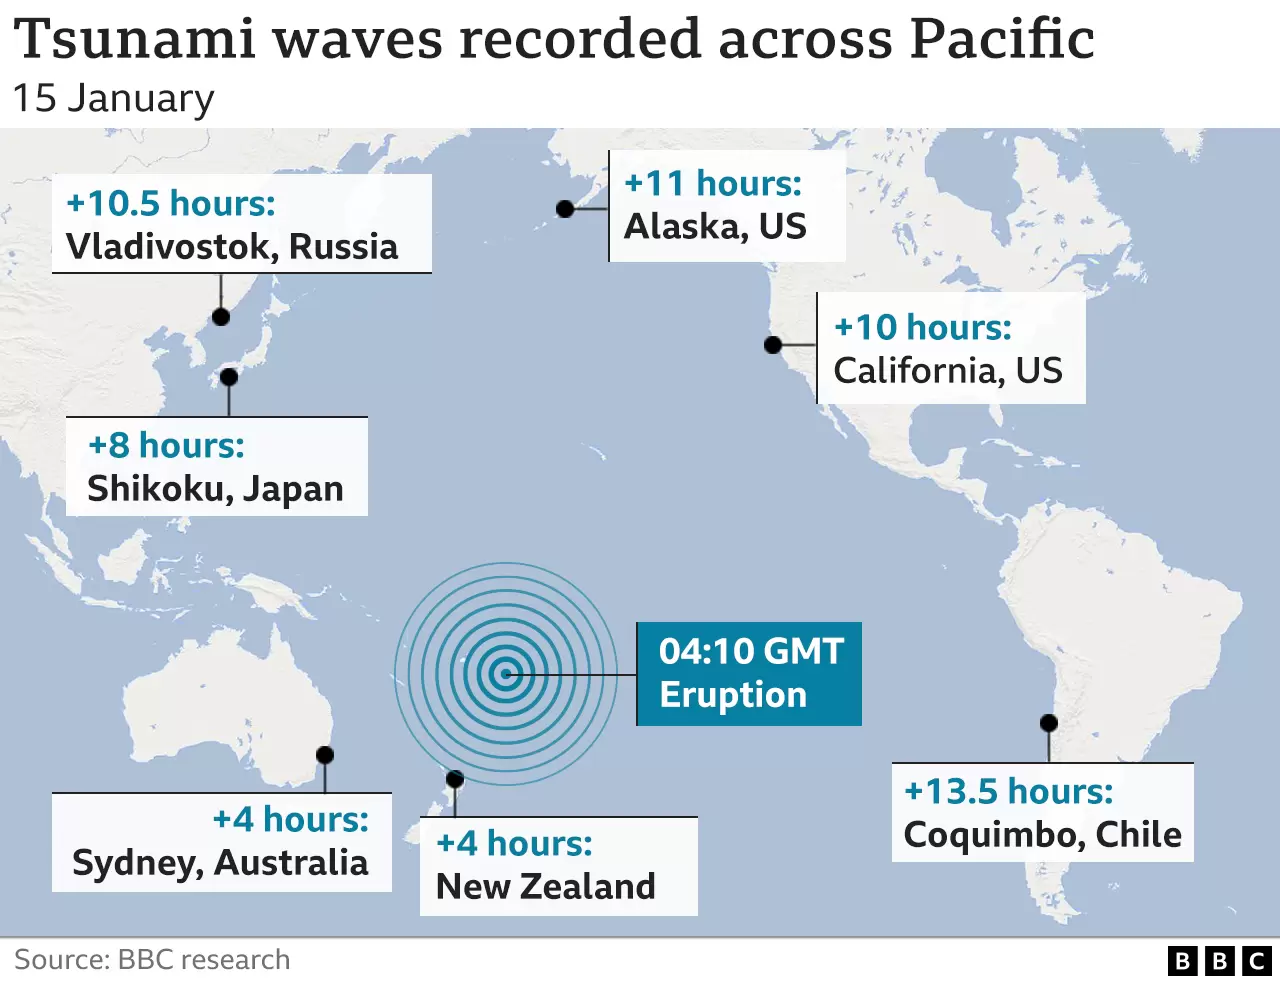
Introduction to the Tongan volcanic eruption.
Location of the eruption. Hunga Tonga, Tonga.
Discussion of the Tongan Volcano Eruption by Dr. Neil Lareau.
Simulation of propagation around the world (NYT source).
Calculation of the time for the pressure pulse to travel to Reno from the volcanic eruption site.
Our measurements of ambient pressure around eruption time. (long time series, medium time, close up, spreadsheet). (From a pressure sensor on the 4th floor of Physics).
Gravity waves emitted by the explosion.
Pressure Measurements at UNR on January 15, 2022. The pressure pulse from the Tongan explosion arrived at 4 a.m.
From here.
Click images for larger versions.
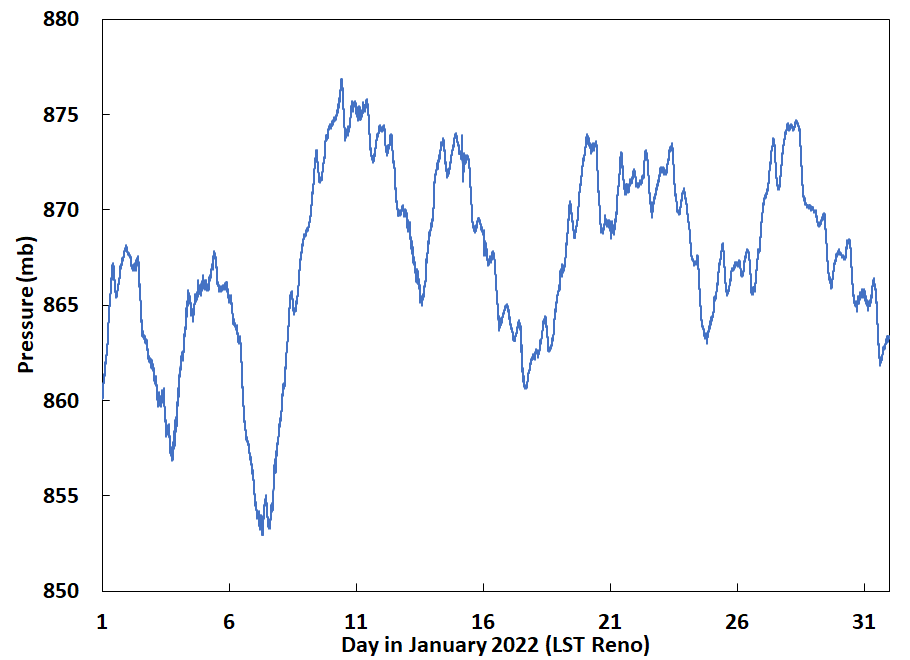
Figure 1. UNR pressure on the roof for January 2022. |
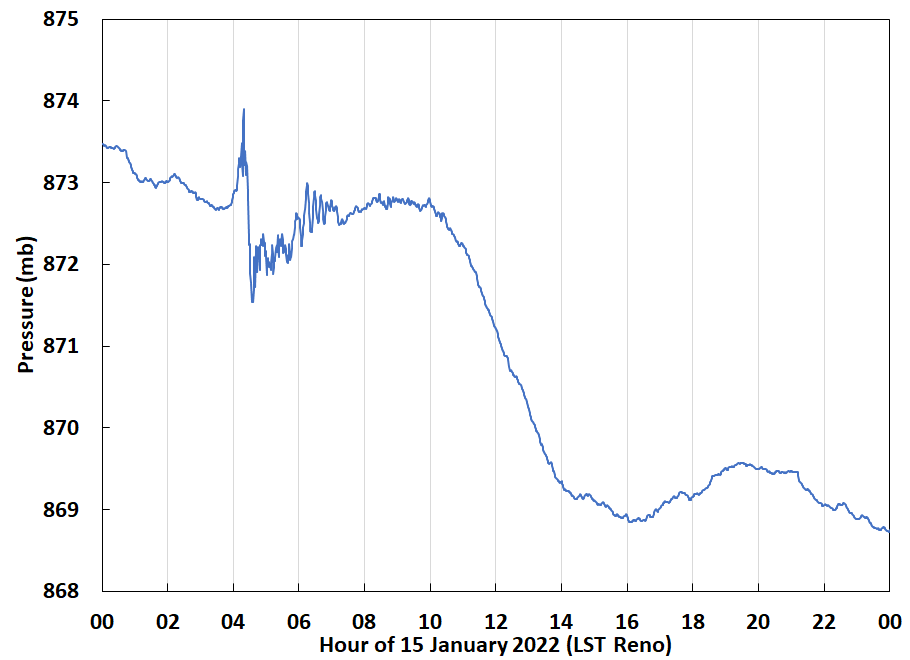
Figure 2. UNR pressure on the roof for January 15th 2022. |
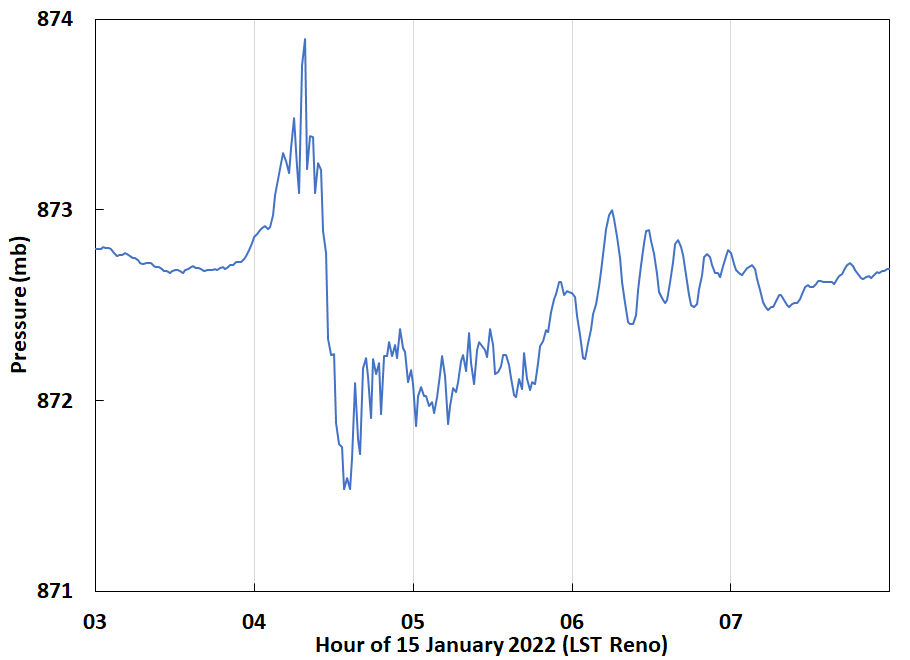
Figure 3. Tongan explosion pressure pulse as measured from the roof of Physics for January 15th 2022. Data is 1 minute time averages. |
Atmospheric Pressure And Air Pollution Observations First For UNR and Reno:
A. Get pressure, temperature, RH, and PM2.5 from Purple Air for the Physics building at UNR for January 2022 both inside and outside the building, with 10 minute time averaging.
B. Use the sensor data and the difference form of the hydrostatic equation dP=-ρ g dz to calculate the height of the Physics building from pressure and temperature measurements. Accurate?
C. Use pressure data from both inside and outside to graph and observe the Tongan volcano eruption pulse around 4 a.m. local standard time (LST) on 15 January 2022 as in Figure 2.
D. Make both a time series and scatter plot to quantify indoor versus outdoor air pollution amount.
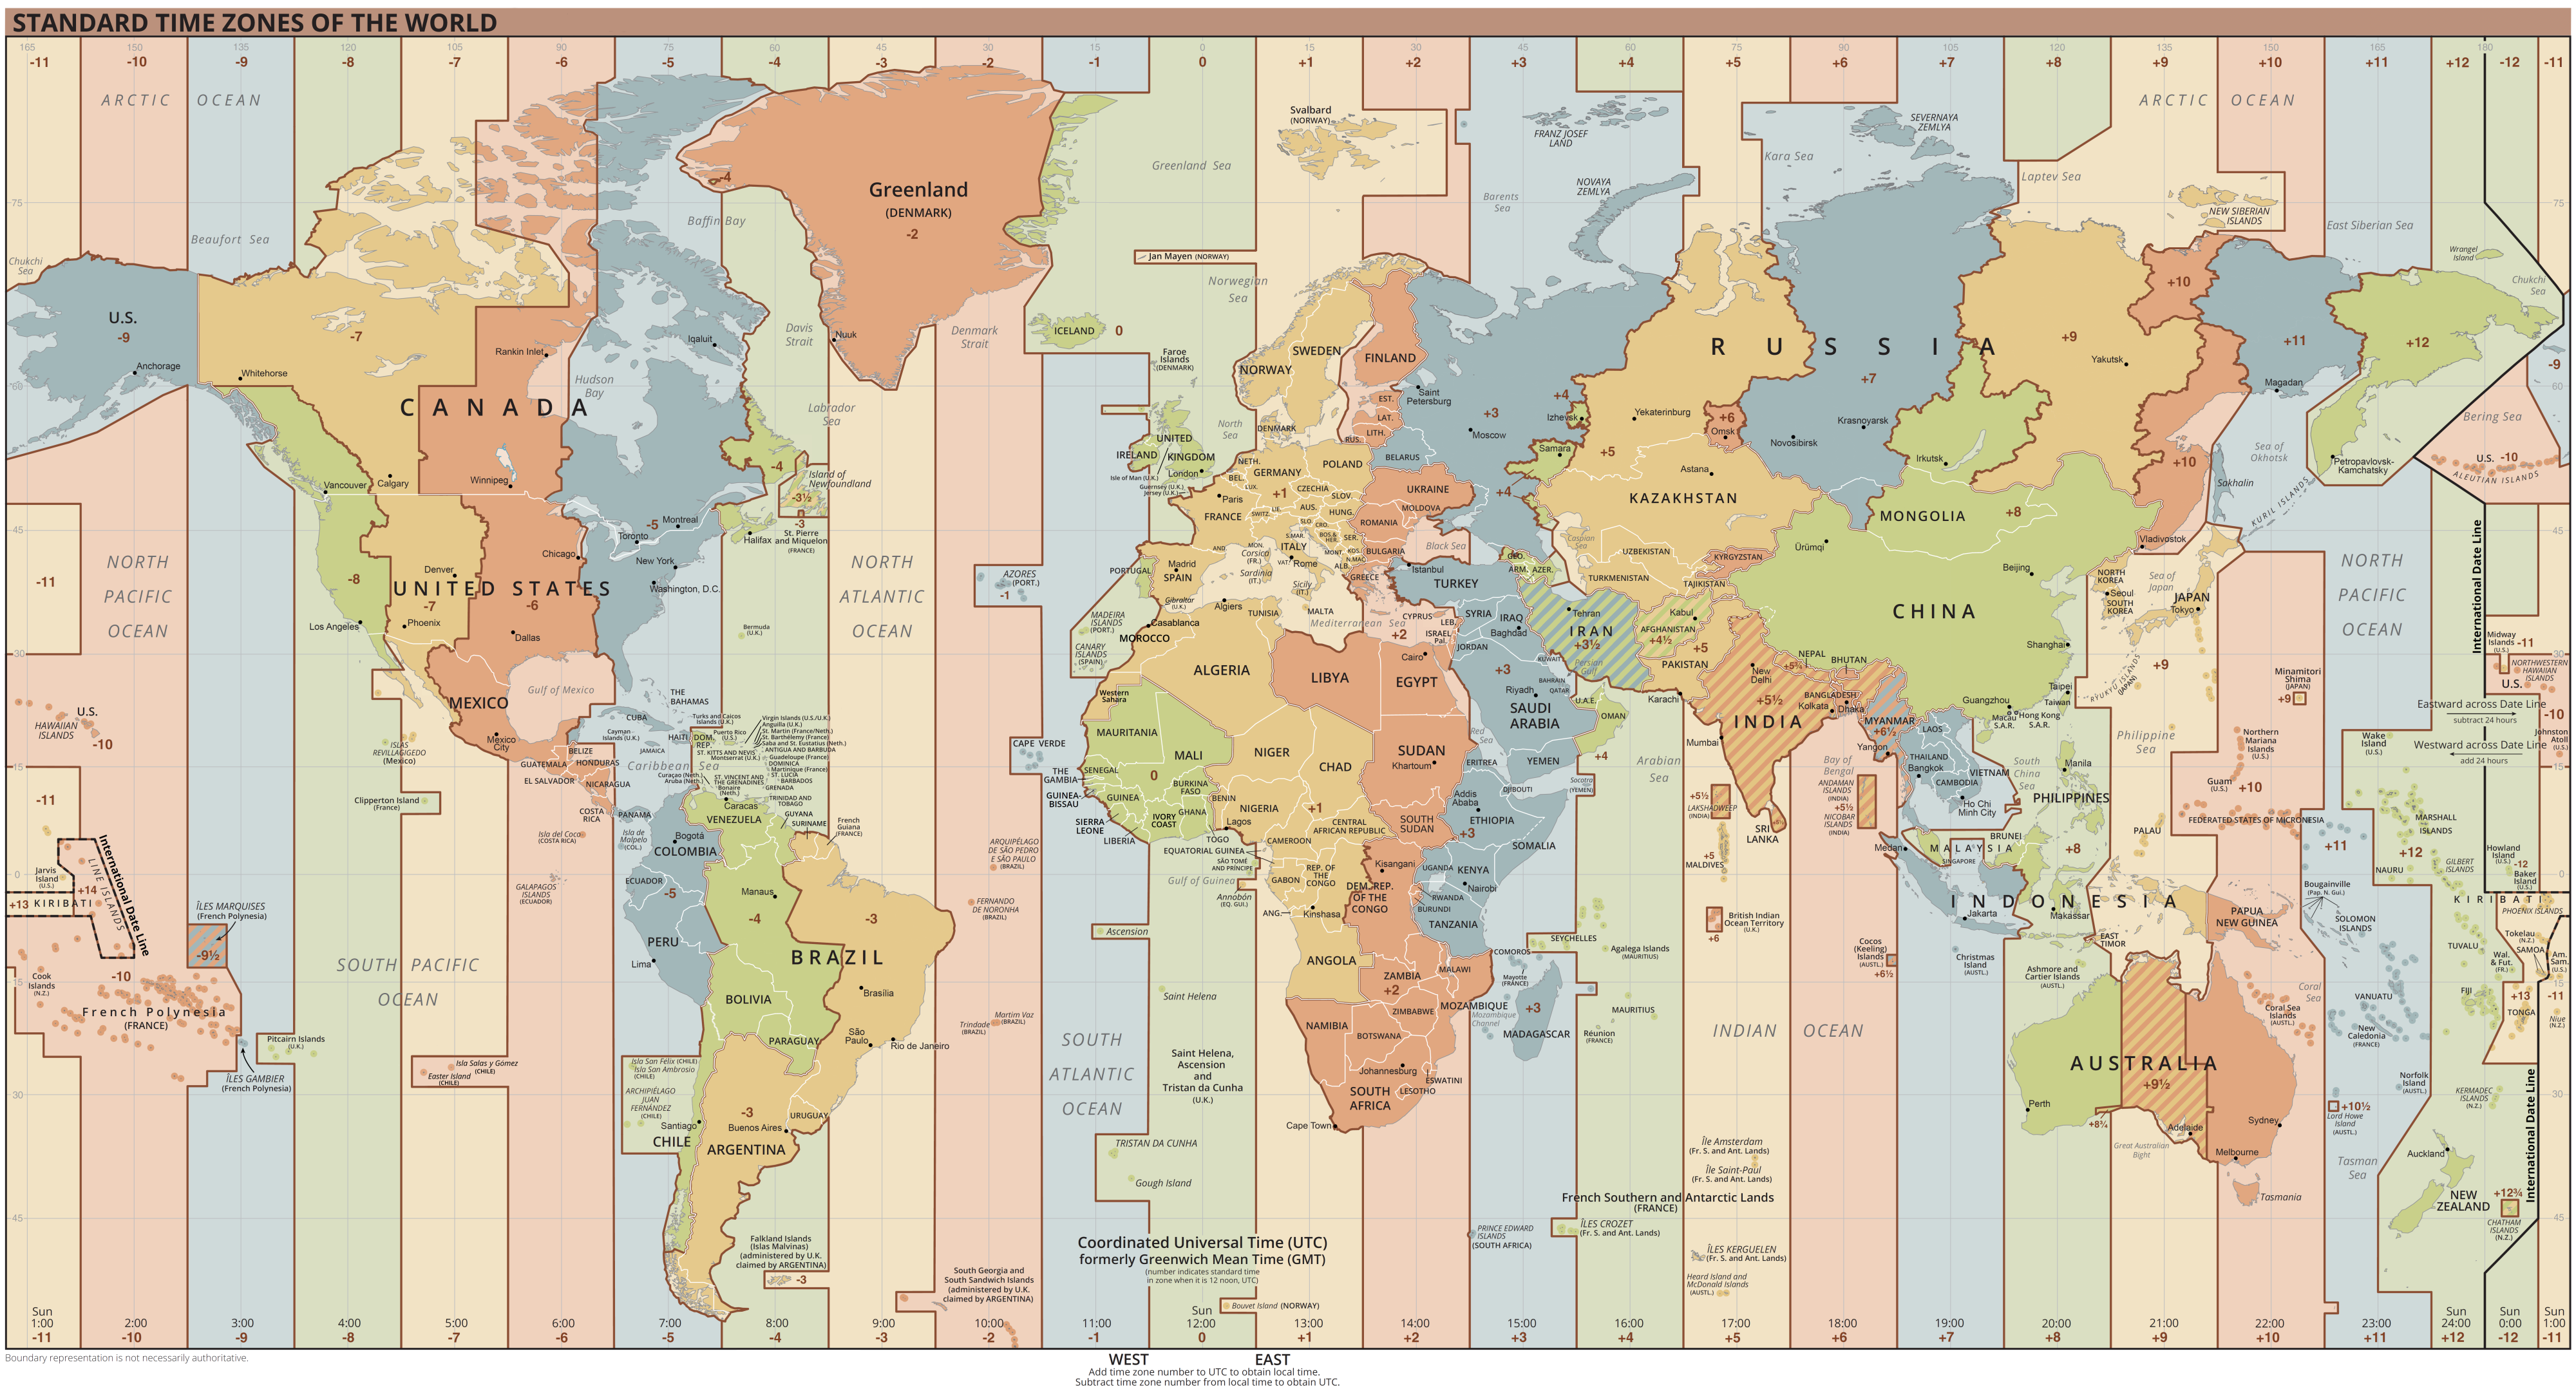
Convert time in UTC to LST for the time series graph. Reno has LST=UTC-8 hours.
Notes on downloading the PurpleAir data:
Use the download tool on the site. Use Excel or other graphics package to make graphs and analyze the data.
Choose the days. Note that "Primary A" has T, RH, and PM2.5. "Primary B" has ambient pressure and PM2.5. A and B refer to the two PMS5003 sensors in the PurpleAir unit.
Atmospheric Pressure And Air Pollution Observations For a Location of Your Choice: Note: Your site icon should show that it has temperature, RH, and pressure sensors. Example.
E. As a class, map the Tongan volcano eruption using the Purple Air network by choosing a location (or more than one) somewhere in the world, and acquiring the data for pressure and PM2.5 on January 15th 2022 with no time averaging so you can see the details of the pressure pulse. You will use the "Primary B" data since it has the ambient pressure.
Convert time to local standard time for your location, by looking up the time zone to get the offset as we did for Reno.
Also gather
data for the entire month of January with 10 minute time average applied.
We will look at both time series for the whole month as well as diurnally averaged data (diel average) to help understand your site.
Use these data to make the graphs listed below under Deliverables: B. Parts 3-8.
Indoor and Outdoor Air Quality: (tentative, additional data that we may use)
Indoor and outdoor PM2.5 from Purple Air in physics for Dec and Jan.
Sonic anemometer data analysis for KE and TKE and pressure for these months.
Compare with the Beta Attenuation Measurements (BAM) made with an instrument that is considered equivalent for EPA purposes.
Deliverables:
A. Report
describing the Reno analysis discussed in parts A. through D. above.
Use lab report format.
You should describe the Purple Air, PMS5003, and the BME280 sensor in your report, in addition to the data.
B. Presentation for your Tongan eruption study with the following slides, for part E.
1. Image or movie of some kind for the Tongan eruption, be sure to reference your source. You could use the NOAA Climate and Weather Toolbox if you want.
2. Google Earth image, or use the PurpleAir map for your PurpleAir location(s) to show what the site(s) looks like.
You can get the coordinates for your location when downloading the data from the PurpleAir site, and I recommend using Google Earth for this image.
3.
Graph of a pressure time series for the entire day of January 15th 2022 using LST on the x-axis, like Figure 2. [PurpleAir data with no time averaging]. Note: For some locations you may need to graph instead January 14th if the site is close enough to the volcanic eruption site.
4. Graph of pressure showing the pressure pulse time series from the eruption in more detail for January 15th 2022, like Figure 3. (Or for the 14th if need be).
5. Graph of the PM2.5 at 10 minute time average data for the month of January 2022. [discuss the site: clean or dirty in January? How much variability?] [PurpleAir "Primary B" data]
6. Graph of the diel averaged PM2.5 (hour of day on the x axis and PM2.5 on the y axis). Also known as the diurnally averaged data so we can see what a typical day looks like.
7. Graph of the diel averaged pressure (hour of day on the x axis and pressure on the y axis). Also known as the diurnally averaged data so we can see what a typical day looks like.
8. Any other meteorological and climate data that helps explain the nature of the site you've chosen.
References and Resources: (see also the PMS5003 page).
1. Long term evaluation of the PMS5003 in Salt Lake City.
Theory for pressure use to measure building height.
Time for pressure pulse to go from the volcanic eruption to Reno.
Standard time zones of the world.
Primary and secondary contributions to air pollution in Mexico City.
Per capita air pollution in the world's cities.
Terrestrial Gamma Ray Burst from the Hunga Tonga Explosion.
Nature of the wave emitted by the explosion.
Discussion of water vapor emitted by the explosion and other topics.
Broad discussion from the BBC of the explosion.
CNN discussion of explosion going to the 3rd layer of the atmosphere.
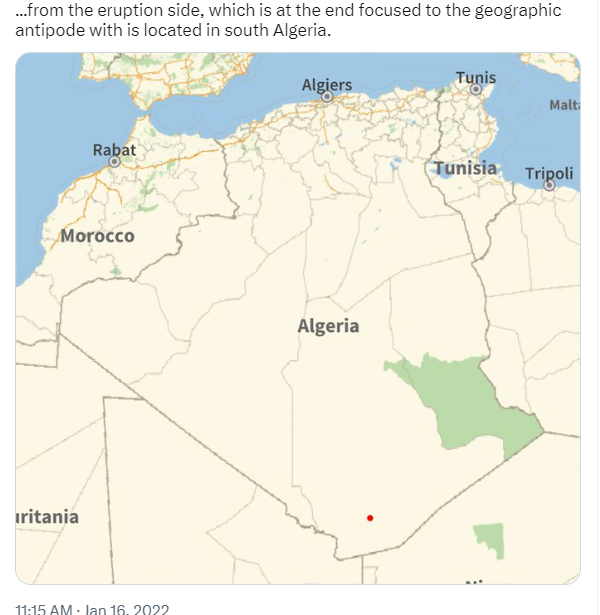
Research paper discussing arrival times and the reflection and multiple reflections, antipode in Africa.
GRL paper modeling propagation around the world, including antipode in Africa.
Iscience paper measuring and discussing the first and second pulses.
REVERBERATION model animation for explosion to reach Algeria at this spot.
Time of pressure disturbance at different locations.
 |
Abuja Nigeria pressure, location near the antipode reflection location in Southern Algeria.
Possibly showing second pulse too.
Good to model general variation with atmospheric tide. Missing data and data quality issues at times. Pulse is around hour 21.
 |
Assignment 9: This assignment will done in class as much as possible.
Title:
Gravity wave clouds in the atmosphere downwind of the Sierra Nevada mountain range:
Study using balloon sounding radiosonde and satellite measurements.
Turn in this homework assignment through webCampus, prepared using Powerpoint.
Observe gravity wave clouds in the atmosphere and perhaps problems with radiosonde measurements.
Purpose:
1. Learn about radiosonde (balloon soundings of the atmosphere), satellite imagery, and an important cloud type for us in Reno, wave clouds.
2. Help diagnose issues with radiosondes when they exit clouds after wetting the temperature sensor. Evaporative cooling of cloud water from the sensor gives abnormally low temperatures.
Deliverables: A Powerpoint presentation with a minimum of 3 slides as follows. (Each student needs to choose a unique year for their study.)
Slide 1: Discuss how polar orbiting satellite imagery is obtained. Examples include NASA AQUA and TERRA satellites, equipped with MODIS instruments.
Slide 2: Discuss how geostationary satellite imagery is obtained. Examples include GOES16 and GOES17.
Slide 3: NASA MODIS/AQUA satellite image showing wave clouds downwind of the Sierra Nevada Mountains.
Example image from 25 November 2020 at 20z.
Slide 4: Atmospheric sounding image of air and dewpoint temperature and winds. Circle the likely layer near 700 mb associated with the wavecloud.
Example from 26 Nov 2020 at 0z. Soundings can be obtained here.
Slide 5: Screen shot of the atmospheric sounding data. Highlight the data near where the likely level of the wavecloud is located.
Note where the RELH (relative humidity) is high and if THTA (potential temperature) decreases with height,
possibly due to evaporative cooling of cloud water from the temperature sensor.
Example from 26 Nov 2020 at 0z. Soundings can be obtained here.
Slide 6: Put your satellite image into Google Earth and measure the wavelength of the gravity wave.
Calculate the wavelength from the lapse rate, wind speed, and temperature. Theory is in this presentation, slides 6-28.
Slide 7: Explore the evolution of the cloud by obtaining an IR movie of the entire day from the NOAA Weather and Climate Toolkit. That will make use of channel 13 data.
Slide 8: Look at the cloud under solar illumination during daylight hours by making a moving from the NOAA Weather and Climate Toolkit. That will make use of channel 1 data.
Slide 9: Conclude with a summary of what you found.
Students may repeat these three slides for different days within their year.
POSSIBLE ADDITIONS TO THIS ASSIGNMENT:
1. Gather both the Terra (morning) and Aqua (afternoon) images
to look at the evolution of the wave cloud during the day.
2. Gather both the morning (12Z on the day of) and afternoon (0Z on the day after, making it 4 pm local time on the day of) to look at the evolution of the atmosphere during the day.
3. Perform cloud type identification from the combination of satellite imagery and soundings.
4. Plot the vertical distribution of potential temperature and interpret.
Resources and Related Information:
Photograph of a wavecloud from the top of the Physics building at UNR on the 7th of April 2021 at around 4 pm local time.
Photograph by Ally of the same cloud earlier in the day.
Satellite imagery of the wave clouds on the 7th of April 2021. Faster and longer duration version.
Sounding for the 7th of April 2021 at 12Z.
Sad sounding for the 8th of April 2021 at 0Z.
NOAA Weather and Climate Toolkit for obtaining radar data and satellite imagery in case you want to get your own geostationary satellite images and movies.
Afternoon NASA/AQUA/MODIS satellite imagery for the southwest US for April 17th, 2003-2021 to show regularity of the events.
GOES satellite imagery for 11/25/2020 LST showing wave clouds.
Low resolution and high resolution soundings for 0z 11/26/2020.
Balloon-based sounding presentation.
Waves in the atmosphere presentation. See especially slides 6-28.
Slide Mountain weather station data relevant to observing the atmopsheric pressure near the crest of the Sierra Nevada Mountains nearby Reno.
Slide mountain weather station observed on Google Earth Online.
Radiosonde discussion.
See https://www.weather.gov/upperair/Study2 for radiosonde errors discussion.
See
https://en.wikipedia.org/wiki/Lee_wave for lee wave discussion.
Chase gravity waves to improve weather and climate models.
Assignment 8
Title: Quantitative Generation and Measurement of Light with
Arduinos/Teensy's, LEDs, and Photodiodes
and Signal Conditioning Using Operational Amplifiers
The goals of this assignment are:
a. Explore the use of LEDs and photodiodes as light detectors for applications as radiation detectors.
b. Introduce a very common, and extremely useful integrated circuit for electrical signal conditioning, the operational amplifier.
c. Reinforce how you can get quantitative measurements from the Arduino and/or Teensy boards.
d. Reinforce the difference between ideal voltmeters and real voltmeters, that meter input resistance matters

By way of review, here's the photoresistor circuit we used in the past for measuring light. Click on the image for a larger version. |
A. We will replace the photoresistor with an LED, now with the LED being used as a wavelength selective detector in addition to as a light source.
Build a simple circuit with a resistor and LED as a photodetector so that you can measure the photocurrent from the LED such that 0.1 microamps produces a 1 volt signal.
See the schematic diagram below.
You can use the modified sketch for the photoresistor response time measurement, and CoolTerm for this lab too.
Adjust 'jmax' to see the effect of signal averaging on the noise reduction.
Record and graph the waveform for the LED as a detector with the output of the LED being measured as the voltage across the resistor.
B. Construct a transimpedance amplifier circuit with an op amp to convert the photocurrent from the LED as a light detector to a voltage so that a photocurrent of 0.1 microamps produces a 1 volt signal.
Add a 4.7 pF capacitor in parallel to the feedback resistor to form a low pass circuit.
Make observations of this waveform as in part A.
Write your data to a file using CoolTerm.
Graph your time series. Compare the response time and noise of these circuits.
EXTRA CREDIT: C. Repeats parts A and B using the OSRAM BPW34 photodiode as a detector instead of the LED.
This detector is much more sensitive than an LED, so you may have to use much less LED light, and also a dark room (or cover up the circuit to shield it from room light.
OSRAM BPW34 Photodiode and PIN photodiode schematic. Click image for larger version.
 |
 |
EXTRA CREDIT D. (As time permits: extra credit). Set up the non inverting amplifier circuit with a feedback resistor of 2k Ohm and 2.2uF capacitor in parallel, with a resistor of R2=10 MegOhm.
Measure a pulse from the LED using the same Arduino program we used for testing the photoresistor.
Show the effectiveness of shielding the circuit with aluminum foil. Photograph of the set up, and example data.
E. Analysis for your report.
a. Present and compare pulse waveforms measured in parts A and B (and C and D if pursued).
b. Estimate the response time, τ, from your time series graph as shown in the figure below to obtain the response time of the resistor/LED circuits.
c.
Using part b, calculate the LED and photodiode capacitance, C, using τ=RC.
Extra credit for your write up.
d.
Discuss the operational amplifier 'golden rules' and derive the equation used to obtain the output voltage relationship with the light detector photocurrent for the circuit of part B.
e. Derive the equation for the low pass filter effect of the capacitor and resistor on the sensor response in part c.
Simple method to estimate the response time.
 |
Resources:
Use of light emitting diodes as wavelength specific radiation detectors,
as they are very useful for use in simple sun photometers, among other applications.
Discussion of operational amplifiers.
Input impedance of a transimpedance amplifier and local backup.
Photodiode technical information sheet.
OSRAM BPW34 photodiode data sheet.
PIN photodiode description relevant to the OSRAM photodiode. (local backup).
Photodiode FDS100 we typically use in our aerosol light scattering detectors.
Thorlabs site that nicely describes use of photodiodes to detect light.
Photodiode discussion.
Resistor and capacitor circuits in the time and frequency domains, and low pass filter response of an RC circuit. (local backup).
Additonal Resources:
Purple air measurements compared with 'standard' instruments.
Alternative calibration scheme for the Purple Air.
Purple air as a device to measure aerosol light scattering coefficients, and supplemental information with pictures of the inside of the sensor.
Additional instruments on the roof of Physics for air quality and atmospheric radiation measurements including the BAM PM2.5 and PM10 monitor.
Tongan volcanic explosion measured from the roof of Leifson Physics: Spreadsheet, broad time series, more details, close up details.
Beta attenuation monitor measurements of PM2.5 and PM10 for December 2021 and January 2022 (EPA equivalent method).
-->
Assignment 7 Arduino, Teensy, and Atmospheric Measurements:
This assignment will be submitted in 3 parts, see webCampus,
parts 1&2; parts 3&4; parts 5&6.
You will need to acquire data in class, write lab notes about your measurements, and write up each section of the lab
as homework as soon after the section is finished so you remember it in detail.
Title: You can decide on the title based on your experience with this lab.
Goals:
a. Become familiar with the Arduino microcontroller as an example of a programmable device for acquiring measurements and controlling systems.
b. Demonstrate ability to modify Arduino sketches for solving problems.
c. Learn about and use sensors with atmospheric relevance.
d. Learn how to bring measurements from the Arduino into computers (interface the Arduino) to acquire data for later analysis and display.
If possible, install the Arduino software on your own laptop (if you have one), and use it in class.
Also download CoolTerm and place it somewhere that you can get to it for ease of use. This program allows us to transfer data from the Arduino to the computer.
The code for the projects in the book and kit is here: expand the file and put the folder in your Arduino examples folder.
Here is a link to the an online version of a manual that is similar to the one we use in class. (local backup).
Be sure to describe the Arduino in the first report on parts 1&2.
Measurements and Analysis
EACH TEAM MEMBER MUST BREADBOARD UP AN ARDUINO, AND GET THEIR OWN UNIQUE DATA.
THE POWER OF THE TEAM COMES IN PROVIDING ADVICE FOR EACH OTHER.
EACH TEAM MEMBER NEEDS TO GO THROUGH THE DATA CURVE FITTING PROCEDURE WITH EXCEL TOO.
WE MIX IT UP BY HAVING EACH TEAM MEMBER STUDY A DIFFERENT COLOR LED,
AND/OR A PHOTORESISTOR OF DIFFERENT SIZES, ETC.
2. Do Circuit 6, pg 40 in the book to learn about the photoresistor and how to measure its output. Then measure the photoresistor response time. An example sketch is given in the next paragraph.
Then create a circuit to drive the LED at different frequencies to see if
the photoresistor resistance can accurately follow the LED output for low
and high frequencies.
Point the LED output directly into the photoresistor input. You can use
variable delay and the 'Blink' sketch to drive the LED to write your own code, or
here's an example sketch that does the calculation in Lux, read through it so you understand it.

Description of the circuit for the photoresistor test. Click on the
image for a larger version. |
If the LED is driven by a square wave, the photoresistance should show a
crisp square wave too. Use the plot monitor on Arduino to view the
photoresistor output,
and save some data with CoolTerm (including time) so that you can graph the photoresistor output from the
LED drive as a function of time.
Obtain an approximate value for the time constant of the photoresistor as a sensor of
light from a graph of the data.
The light intensity is calculated using the equation LUX = 1.25*107*Rp-1.41 where Rpis the photoresistance in Ohms. (local backup of link).
Then work out the response time of the photoresistor for measuring light using the Solver within Excel.
As time permits, do one set of curves for room lights on, and another for lights off. Is
there any difference in the time constant caused by spanning the
photoresistor over such a large range of light intensity?
Be sure to photograph your setup and use it in your report.
Include your graphs showing the model fit to measurements, the theory,
discussion of how photoresistors and LEDs work,
what is the response time and why are we interested in it, etc, you can be creative.
3. Do Circuit 7, pg 44 in the book to be become familiar with the TMP36 temperature sensor.
Answer these questions in your write up.
What is the principle of operation of the TMP36 temperature sensor? How was its signal obtained?
Obtain and discuss the time constant for the sensor as you are warming it up with your fingers, and the time constant as you are cooling it off by letting it sit in air.
First use the sketch for circuit 7 to view the measurement. Then proceed with the sketch mentioned below the figure
Description of the analog to digital conversion for the TMP36 sensor. Click on image for a larger version.

|
Example sketch for response time measurement. Read it and follow instructions.
Note especially the way that time averaging is implemented in the sketch with the function at the bottom of it, and the difference in this sketch compared with the one for circuit 7.
Pinch the temperature sensor to warm it up when the LED comes on.
Record a time series with CoolTerm as you pinch the the sensor to warm it up to a steady temperature, and let it decay to a lower temperature.
Obtain and discuss the time constant for the sensor as you are warming it up with your fingers, and the time constant as you are cooling it off by letting it sit in air.
Presentation on the TMP36 temperature sensor principle of operation
4. Create a voltage divider circuit to measure the resistance of the thermistor sensor using a fixed resistance of 1 MegOhm (1,000,000 ohms). This circuit is similar to the photoresistor circuit.
Answer these questions in your write up.
What is the principle of operation of the thermistor temperature sensor? How was its signal obtained?
Obtain the time constant for the sensor as you are warming it up with your fingers, and the response time as you are cooling it off by letting it sit in air.
You might also be able to put the board and sensor into the freezer or toaster oven (on low heat setting) and do the measurements for the response time that way.
The TMP36 sensor is roughly a cube with sides of length 4.6 mm.
The thermistor sensor is roughly a cube with sides of length 1 mm.
Estimate the ratio of the volume of the sensors.
Also estimate the ratio of the surface area of each sensor.
Calculate the ratio of the response time of the TMP36 sensor to that of the thermistor sensor, one ratio each for heating and cooling.
Does the ratio of response times compare mosty closely with the surface area ratio, or the volume ratio?
Calculate the temperature that corresponds to your measured resistance using the equation given here (thanks Alex).
Record a time series using CoolTerm as you pinch the the sensor to warm it up to a steady temperature, and let it decay to a lower temperature.
Obtain the time constant for the sensor as you are warming it up with your fingers, and the time constant as you are cooling it off by letting it sit in air.
Here's an example sketch to use for the thermistor sensor evaluation. Read the sketch for instructions on what to do.
Pinch the thermistor carefully (without affecting the wires) when the LED is on.

Click on image for larger version.
Thermistor presentation
5. Set up a circuit and sketch to acquire data from the pressure sensor.
Answer these questions in your write up:
How does the pressure sensor work? It may be helpful to look at the data sheet and information on the pressure page.
Can you see measure the pressure difference between the lowest level you can get it, and the highest level?
Is that pressure difference correct?
Is the pressure sensor properly temperature compensated?
Do appropriate data averaging so that you can easily tell the pressure difference
between having the sensor on the desk, and having the sensor about 1 meter higher or lower. Record data with CoolTerm to demonstrate your results.
Here's an example sketch for the pressure sensor. You'll have to comment out some lines near the end to get only the pressure measurements to CoolTerm.
Do measurements with 1 second time average, holding
the sensor down for 10 seconds, then up for 10 seconds.
Then modify the code to obtain 10 second time averages. Test by holding the sensor low for 100 seconds, and high for 100 seconds.
Comment on the effects of additionally time averaging the data.

Click on image for larger version.
Note: It seems the 10 bit analog to digital (a/d) converter of the Arduino would not be able to resolve a pressure difference of about 0.1 mb associated with
1 meter height difference. 1 bit change in the a/d counts corresponds to a voltage change of about 0.005 volts, and a pressure change of and about 1 mb pressure.
Dither helps: the voltage source for the Arduino is noisy enough to cause around 50 mv or so of noise so that the a/d counts fluctuate to a useful average.
The example sketch for pressure averages the measurements of the pressure sensor voltage and the voltage divider voltage about 1800 times for each measurement.
Use of the voltage divider for the power supply voltage measurement is necessary since the a/d range is 5 volts, and direct measurement might be over the measurement range.
If you are ahead, you may add the digital pressure sensor to the sketch and breadboard layout and compare the analog and digital sensors.
6. Implement the infrared sensor.
Use Arduino and Coolterm to demonstrate its performance.
Interface it with Labview using the indicated code as time permits.
Here is an example sketch to use with the IR sensor. Note that to make it work on your laptop you'll need to install the Adafruit software library as discussed here.
Demonstrate a time series of temperature by moving your hand over the temperature sensor quickly, using Labview and CoolTerm by doing a screen capture or other means.
Here is the Labview code. Unzip the file to get to the code. Double click the program named Read_IR_TemperatureSensorData.vi.
Saving data with Labview requires that you choose a folder that already exists.
Include a discussion of how the sensor works.
Those with laptops can take the IR sensor outside to get a time series of infrared brightness temperature of various targets.

Notes on the IR sensor: Click on image for larger version. |

IR Sensor wiring diagram (from Adafruit).
Note the orientation of the tab on the sensor.
Click on the image for a larger version. |
Answer these questions in your presentation:
How does the pressure sensor work? It may be helpful to look at the data sheet and information on the pressure page.
What does it mean that we call this a digital pressure sensor?
What is the I2C bus used by this and other sensors to get measurements from the sensor.
Can you see measure the pressure difference between the lowest level you can get it, and the highest level?
Is that pressure difference correct? Use a meter stick to measure height. Take photographs of your set up and work with others.
Note that the sensor measures temperature too, and this temperature is a combination of board and room temperature.
Demonstrate that this sensor has light sensitivity by shining you cell phone light on it and observe the pressure response. (Not a desired feature).
Include your Arduino code in the report at the end, highlighting how you got it to record measurements at a 1 second interval.
The pressure measurements in the room from the indoor Purple Air instrument can be used as a reference for your height measurements. Be sure to convert to local standard time.
Do appropriate data averaging so that you can easily tell the pressure difference
between having the sensor on the desk, and having the sensor about 1 meter higher or lower. Record data with CoolTerm or the serial port monitor to demonstrate your results.
Here's an example sketch for the pressure sensor.
Set up a programming loop to get 1 second time average of data
so that you can compare the performance of this sensor with the one we used in step 5.
Repeat the last step with 10 second time averages the data
This will allow you to become more familiar with Arduino programming.
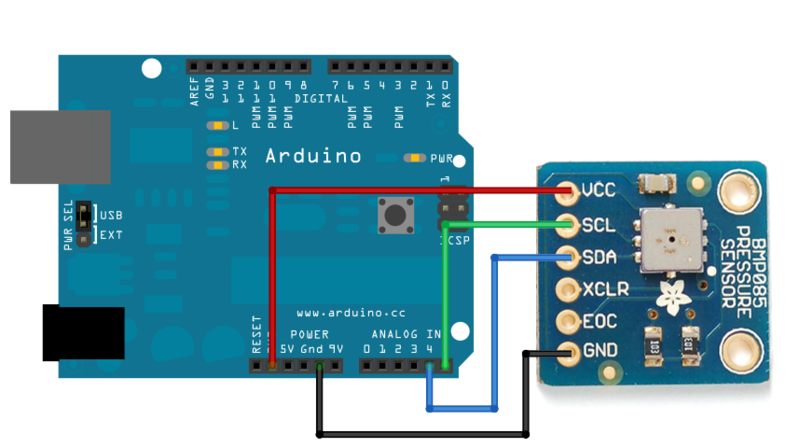
Click on image for larger version. Image from here. Note that this image is for the BMP085 sensor.
Just find the SCL and SDA terminals for the BMP180 sensor.
Project Ideas For Future Work:
1. Develop a weather hardened version of the infrared sensor by 3D printing a housing for it and a Teensy 3.6 microcontroller.
Here are examples.
2. Develop the differential pressure sensor into a windspeed measurement tool. Discussion 1. Discussion 2.
3. Develop a gust probe for turbulence measurements. Paper 1. Paper 2.
Additional Resources:
Description of the Arduino and some sensors we'll use.
Discussion of microcontrollers in general.
TMP36 temperature sensor data sheet.
Presentation on the TMP36 measurement principle.
Thermistor presentation
Very useful voltage divider circuit to use for measuring sensors that depend on resistance.

Click on image for larger view.
Assignment 6
The goal is to develop skill in working with meteorological radar data.
This assignment works with precipitation and Doppler data from NEXRAD radar.
Practice giving presentations of meteorological data.
Deliverables:
1. Presentation turned in through webCampus. (50 points possible)
2. Present your presentation to the class. (50 points possible)
Choose a specific radar for your study. Here's where you choose the radar.
Find the coordinates of your radar for locations in the continental US (for Alaska, Hawaii, etc you'll need to estimate the coordinates).
Presentation Contents:
1. Put your radar coordinates into Google Earth and make an image of the location of the radar.
2. Get a GIF movie of at least 6 images of base reflectivity data from your radar a day when precipitation is present.
Use the Save Data tab to make and save the GIF movie.
3. Get a base velocity GIF movie of base velocity for the same time.
Use the Save Data tab to make and save the GIF movie.
Note: You can also use the NOAA Weather and Climate Toolkit if you want to use past radar data.
In your presentation:
Discuss the location of your radar, in particular, any challenges that come about due to location.
Discuss the dbZ level of your base reflectivity image. Is it large or small?
Discuss your base velocity image, interpreting wind direction and speed.
You can add other related meteorological data to enhance your presentation.
Resources
Install Google Earth, or use it with a browser.
Install Powerpoint or use it from a browser, or use Google Docs, or Pages on the Mac.
It may be useful to also explore the National Weather Service radar site.
NOAA Weather and Climate Toolkit if you want to use past data.
Assignment 5
The goal of this quick-study style lab is to become familiar with meteorological radar used to detect precipitation.
Examples are on this page for composite reflectivity and for the Reno NWS dual polarization radar measurements.
Example of Doppler image for Des Moines Iowa.
Submission is through webcampus. Copy these questions to MS word and work on them.
Be sure to give your sources for answers.
Basics:
1. What diameter range are raindrops?
2. What diameter range are drizzle drops?
3. What diameter range are cloud droplets?
4. What is the shape of raindrops?
5. Why don't raindrops get arbitrarily large?
Local Rain Measurements:
6. What is the rainfall rate equation?
7. How does a simple rain gauge work?
8. How does a tipping bucket rain gauge measure rain?
9. How does a disdrometer work?
Weather Radar.
Weather radar presentation as powerpoint and as a pdf document for understanding radar and dbZ.
10. What is the name of weather radars used by the National Weather Service?
11. What wavelength range used by
this radar?
12. Briefly, how does radar work to measure rain?
13. Calculate the size parameter x=2 pi * Raindrop Radius / radar wavelength.
14.
What 'radiation regime' is the size parameter of question 13? Note that it is the same radiation regime that gives rise to the blue sky on a clear day. Note.
15.
What is the basic relationship for radar backscattering in terms of number of raindrops per volume, back scattering strength, droplet diameter D, and radar wavelength lambda? Note.
16.
Why must the radar be empirically calibrated for rainfall rate given question 15, and question 6?
17.
How does Doppler radar work? What can be detected with it?
18. How does dual polarization radar work, and what can be detected with it?
Resources:
National Weather Service discussion of weather radar.
Understanding radar discussion from the weather underground.
Assignment 4 Online (see webCampus) precipitation estimates.
Purpose: Become familiar with precipitation estimate measurements.
Assignment 3 Online (see webCampus) measurement of atmospheric temperature.
Purpose: Become familiar with atmospheric temperature measurements.
Assignment 2 Online (see webCampus) overview of Atmospheric Instrumentation.
Purpose: Broad overview of atmospheric instrumentation measurements.
This is an online homework assignment and is described on webCampus.
Assignment 1 Online (see webCampus) atmospheric radar measurements.
(Top of page) .


