After many meetings with each group, we are ready for each group to do their final presentations.
Our schedule will be to meet in class today (May 3rd), 4 pm, for at least one presentation (the radiation group).
The final exam date is scheduled for 4:30 pm to 6:30 pm on Thursday May 5th. We could move the exam date, on mutual agreement, to Wednesday May 11th 4:30 pm to 6:30 pm to give folks optimal time for finishing up projects.
Presentations are needed for the groups:
Radiation
Air pollution
Wind and turbulence
Photoacoustic sensing of aerosol
Telephotometer/telescope observations of spectra
Radon
Presentations should be about 20 minutes long each. The radiation presentation can be longer (and needs to be) because it is a large group. Afterwards be sure to send me a copy of your presentation.
See you in class today.
Another FET operation from http://www-g.eng.cam.ac.uk/mmg/teaching/linearcircuits/jfet.html.
JFET operation from http://www.st-andrews.ac.uk/~www_pa/Scots_Guide/info/comp/active/jfet/jfet.htm
Week 10 March 31st Measurements
Today we have the radiation group looking at the early morning inversion and perhaps late afternoon cirrus clouds.
We are under extreme high pressure today with very still conditions.
The air motions group got their ultrasonic anemometer installed yesterday on the 4th floor roof and it is measuring winds today as well.
Here are the water vapor movies (broad and close up) for observing the atmospheric circulation.
Here is the morning sounding, clealy showing a strong inversion at 5 am local time.
Brandon: Radon detector and interface with Arduino microcontroller.
Taylor: High voltage generation and use in gas break down spectroscopy. Prepare sunphotometers for sale.Add UV channels for O3 and SO2??
Marce, Josh, Stephen, Kasey, and Narayan: Radiation group, FTIR spectroscopy of the atmosphere, sun photometry for aerosol optical depth and water vapor column. Also, snow crystal observations when appropriate.
Darren and Mike: Spectra of celestial optics: Use of the moon for measuring atmospheric spectral aerosol optical depth at night, using ocean optics spectrometer and Meade auto tracking telescope.
Anthony and Jackie: Portable instrument package use in sampling temperature, RH, pressure, GPS, PM2.5 concentration, and CO2 on mobile platforms. Microenvironment analysis for sharp temperature inversions in cold pools.
Andrew and Albert: Digital lockin amplifier with the Arduino and application to particle asymmetry measurements.
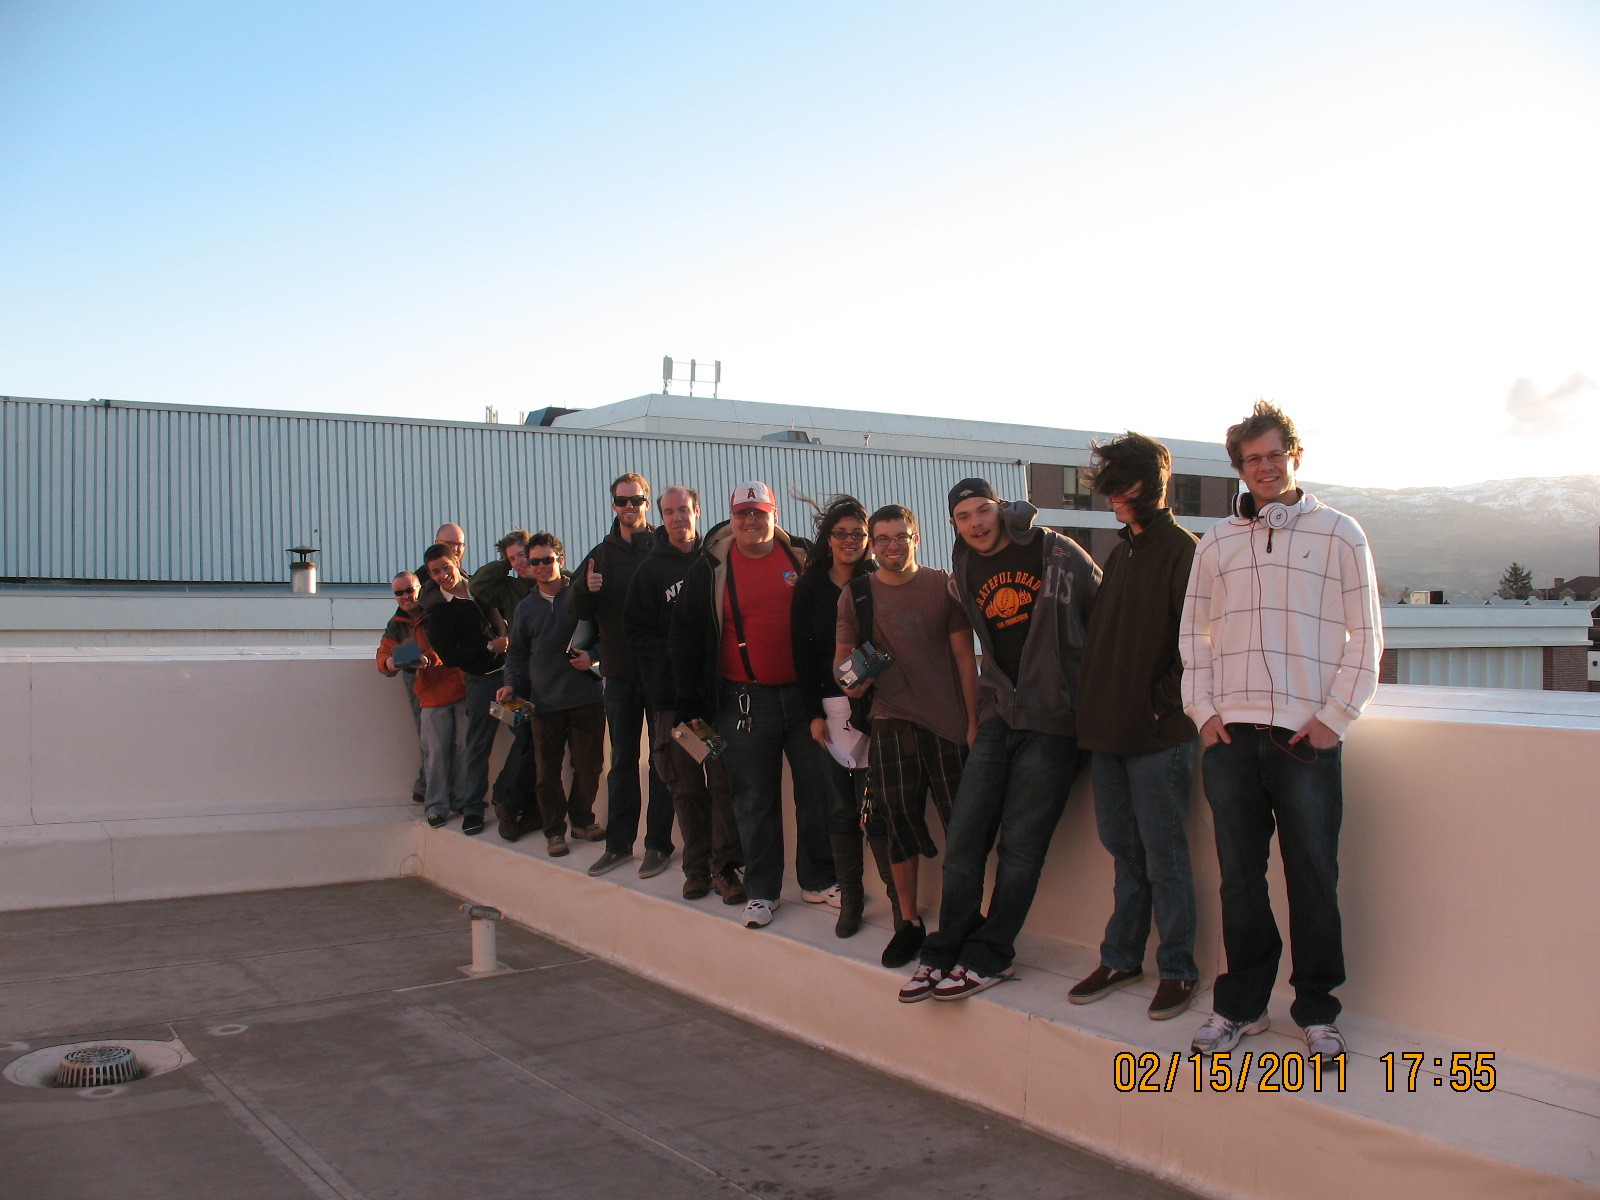
Sunphotometry on a blustery Tuesday afternoon. Click on image for a larger version.
SUN PHOTOMETERY measurements outside with hand held sun photometers. Associated work: Homework 3.
The weather today is sunny but windy. We take advantage of it. See homework 3, the sun photometer notes on the main page.
Extra Credit Assignment: How does your voltmeter and ohmeter work? What is a thermistor, how does it work?
Wet bulb depression versus temperature to get the dew point temperature and the relative humidity from measurements of two thermistors, one wetted with a moist cloth.