ATMS 360 Homework and Course Deliverables (return to main page)
[How to write lab report]
Assignment For Extra Credit [extra credit: Due at the last day of class. Write up in complete form, abstract, intro, etc]
The Rim in 2013 was one of largest and most destructive fires in recent history in California. This assignment
looks at how to go about doing a historical analysis of an air pollution event. Here are the steps to perform as
you prepare your report for this case student. Reno was affected also by the American River fire during
this time interval.
1. Obtain the UNR AERONET level 1 aerosol optical depth (AOD) data (as an image from the website) for
31 August 2013. Notice that the AOD has a minimum at 21:00 Z, but peaks earlier at 16:30 Z and later
at 00:00 Z on the 1st of September. The goal of this report is to investigate back trajectories for this time
interval to try to understand the cause of the AOD minimum. This figure will be Figure 1 in your report for this
assignment. Note that at this time of year, local time is Z time minus 7 hours.
2. Obtain the historical fire detections and fire radiative power maps in kml format to be opened with Google Earth,
for the 31st of August 2013. This data should allow you to find the latitude and longitude of major fires potentially
affecting the air quality in Reno. The coordinates of these fires can be used to do forward trajectory analysis at different times
of day for your report. The fires closest in time will be likely the most important for creating the observed smoke. We
will create several images using Google Earth to show back and forward trajectories and fire locations.
3. Now let's see what the UNR weather station shows for the local meteorology around this time. We'll use one of the online
tools to make graphs of surface solar radiation,
mean wind speed, wind direction, average air temperature, barometric pressure,
and downwelling long wave IR (use metric using and be sure each image is large enough so that when it is copied into your
MSword document that it has good resolution.
Let's use the "Time Series Graphs" link. These figures will be numbered Figure 2a through 2f.
Taken together, what does this data likely show for the effect of the fire on the solar radiation on the 31st?
Is the 1st of September likely cloudy? Discuss this in the text.
Do you notice any possible effect of the smoke (or lack of) on the meteorology on the 31st? Discuss this in the text of the report.
4. Now do backward and forward trajectory analysis (from the fire forward in time, and from Reno, backward in time) to
evaluate the source of the air 100 m and 2000 m above Reno, and forward from the fires starting at 100 m above the fires,
to evaluate the minimum in AOD seen at 21:00 Z in Reno on the 31st, compared to the maxima that
earlier and later times. Be sure
you create a KMZ file for Google Earth for trajectories you want to be part of your report. Create and save
an image from Google Earth
to use in your report.
5. We may also look at the UNR in situ photoacoustic data and the Washoe County EPA sponsored PM2.5 data to look at ground level
air pollution measurements for this case study.
Assignment 5
We did meteorological measurements with the balloon sounder, radar acoustic sounder, and ultrasonic wind speed measurement instrument
on 9 April 2015. Students visited the site. This assignment is to work within 1 of 5 groups to analye the data from these measurements.
The group assignments are here. If you missed class on Tuesday, 14 April 2015, then you will be assigned a group on Thursday 16 April 2015.
Each group will make a presentation of length 10 to 30 minutes on their topic, discussing the basics and the data.
Tentative due date is 21 April 2015.
Assignment 4
In this assignment we work with light emitting diodes, analog and digital electronics, and use the Arduino adaption of the microcontroller.
Here is the framework for this assignment. Here is an brief paper on LEDs.
Assignment 3
We developed a case study for June 1st 2012 AERONET data analysis, showing the AOD over Reno as measured with the UNR Cimel
sunphotometer. We went through HYSPLIT back trajectory analysis. We developed the basic requirements for this homework assignment
as given here.
Write a paragraph on each of the questions posed in the homework assignment description.
Assignment 2
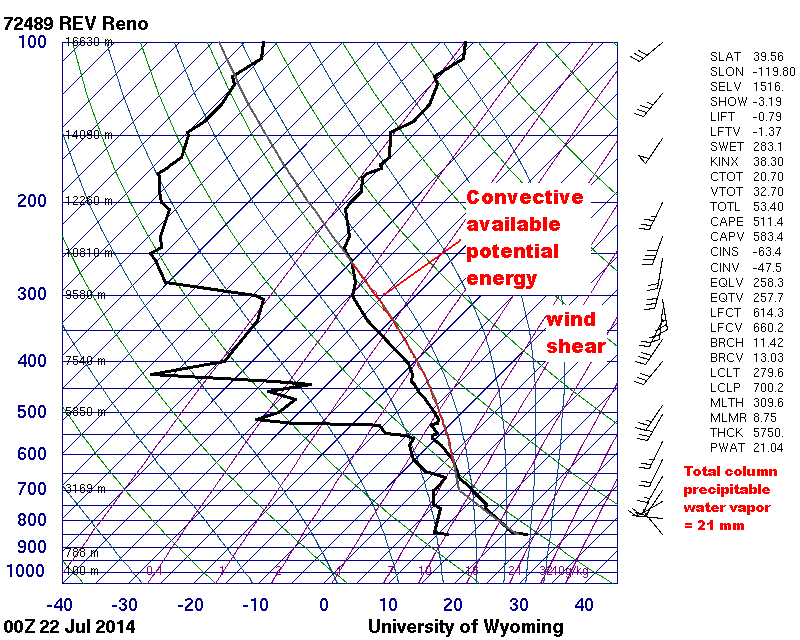
This assignment is about atmospheric soundings; learning about how they are obtained and how to interpret
data from the skew T log P graphs. This report will be due on Thursday Feb 12 during class, and you will email me
your report.
Here's the framework of the report we worked on in class concerning atmosheric soundings, and a start at Figure 3.
Report. Figure 3.
Assignment 1
Use data from the UNR and DRI weather stations (converted to graphical form) to answer this question.
Does Reno have temperature inversions in the first 150 meters of the atmosphere above the surface in the month of July 2014?
If so, discuss the reasons, and be sure to note any references you use in your discussion.
If you find temperature inversions, calculate the average fraction of the day for an inversion, and the average value of the negative lapse rates for all inversions.
Extra analysis could include histogram analysis and/or the average inversion for different months and/or years.
Present your homework in discussion form, describing where you obtained your data from, and the meaning of it.
Bring your draft report in electronic form to class on Thursday 5 February.
The final report will be due the following Tuesday.
| All of the Western Regional Climate Center Weather Sites | click here | |
| LOCAL WEATHER STATION DATA MANAGED BY THE WESTERN REGIONAL CLIMATE CENTER AT DRI PASSWORD IS wrcc14 | SITE DESCRIPTION | Current Data Graphs to see what's going on |
| UNR Weather Station on Valley Road | click here |
click here |
| DRI Weather Station | click here | click here |
| Slide Mountain Weather Station | click here | click here |
Lab reports will be written the same format we use for scientific papers and for student senior, MS, and PhD theses.
One goal of this class is to work on your ability as a science writer.
Let me emphasize one word here. SCIENCE SCIENCE SCIENCE SCIENCE SCIENCE SCIENCE!!!!
So often we are obsessed with the technical details of the measurements that we don't cover the science adequately.
The following elements are needed for your lab report to be complete.
Here is an example of some hints I found using a google search with the keyword "how to write a scientific paper".
Page length doesn't matter; it's all about the contents.
Make it as short as possible to get the message across in a clear manner.
Title: The title should cover the science objective and maybe mention the instrument(s) used for the measurement.
Abstract: The abstract is a brief discussion of the findings of your work. It should be well written because it is often what is read as someone makes a decision to read your work (or fund your research).
Hint on writing abstracts.
Introduction: Explain the scientific goal in more detail and maybe hint at the measurement methods used.
Measurements: Discuss the measurement methods, including uncertainties.
Discuss the instrument(s) and the pertinent information needed to convey what you measured.
Observations: Display your observations and interpret them for your reader.
Make clear, legible graphs with large fonts, clear symbols, and clearly documented results.
Conclusions: The conclusion should summarize your observations and perhaps make suggestions for future work.
References: References refer to specific articles and/or books, etc, that you reference in your paper.
HERE IS AN EXAMPLE LAB REPORT
(Top of page)