| UNR weather data, daily, long term (access code wrcc14). Satellite Images of visible, IR, and water vapor. Daily plots of solar and thermal radiation at the surface. |
Mie Theory Sphere Calculator Atmospheric IR Calculator Dewpont Temperature Calculator. |
Aerosol Optics Measurements. NCEP Reanalysis Data Set Tool for soundings. Atmospheric Animations |
Atmospheric radiation transfer code. |
NASA Terra and Aqua Satellite Images |
Atmospheric Sounding Data from UWyo. Balloon Trajectory Calculation Reno = 39.5386 lat -119.8171 Lon |
Week 16: 10 May 2012
1. Surface albedo measurements.
2. Automated spectral sun photometer.
3. Lidar and supporting docs.
Week 11: 9 April 2012
Groups are busy with their projects; everyone should be getting data and understanding it, as well as understanding how their instruments work.
Week 8: 12 March 2012
Notebooks due on Thursday March 15th. Bring questions about labs 1 through 3 to class on Tuesday.
We will discuss projects again on Tuesday and Thursday, and will do a brief lab on Arduino microcontrollers.
We also will have a discussion of atmospheric pressure measurement. Demonstrate pressure with motorola sensor.
Weather balloons, radiosondes: Presentation, data. Humitter data sheet.
Week 7: 5 March
NOTE: It is important to come to class every time. Most of what we do is class time oriented. Let me know if you must miss a class. Otherwise, we all will miss your presence in class.
This week we will finish the sun photometer analysis, and lab 2. Notebooks will be due next Thursday, week 8, including labs 1 through 3.
Group Ideas:
1) Raman spectroscopy, sunphotometery, and solar aureole measurements (backup) for aerosol chemistry, size, and intensity. Image analysis with NIH Image.
2) Spectral properties of water bodies and snow melt: Single and multiple scattering measurements.
3) Weather station development for UNR - including web site.
4) Downwelling Spectral IR and ultrasonic anemometer wind measurements to diagnose radiative forcing by atmospheric aerosol.
LAB 2 DISCUSSION:
Infrared Irradiance - pyrgeometer instrument. 4.5 to 100 microns wavelength. We will look at my silicon wafer and think about how to make one.
Broad band Solar Irradiance 300 nm to 2.5 microns - pyranometer instrument.
Our solar total and UV sensors: Davis instruments.
Here is the summary presentation of aerosol and cirrus cloud optical depth measured by the Cimel sunphotometer, and presented by Marcela Loria.
David Karr's spectrometer measurements of atmospheric optical depth.
Here are some of David Karr's measurements from the handheld sunphotometer:
Week 6: 28 February
NOTE: It is important to come to class every time. Most of what we do is class time oriented. Let me know if you must miss a class. Otherwise, we all will miss your presence in class.
This week we will analyze our data from the sunphotometer measurements of aerosol and cirrus cloud optical depth.
HELPFUL RELATED INFORMATION FOR SUN PHOTOMETER WORK:
Sunphotometer lecture notes.
Presentation on sunphotometers and solar radiation.
Example of sunphotometer measurements on 27 June 2007.
Sunphotometer Lab 3.Air mass and Rayleigh Extinction coefficient calculator.
2012:02:23 16:15:54
2012:02:23 16:19:33
2012:02:23 16:25:48
2012:02:23 16:27:37
2012:02:23 16:33:35
2012:02:23 16:59:04
2012:02:23 16:59:17
2012:02:23 16:59:46
2012:02:23 17:00:31
Week 5: 21 February
NOTE: It is important to come to class every time. Most of what we do is class time oriented. Let me know if you must miss a class. Otherwise, we all will miss your presence in class.
This week we will finish the section on circuit board layout, and will illustrate how to prepare an order for a circuit board of your design from your schematic.
LAB 2 has been posted on the homework page. You'll need to get busy with it. We will discuss, in class, some of the steps leading up to this lab.
A nice site showing the solar concepts with graphics is this one.
A nice site showing practical aspects of solar radiation for alternative energy uses is this one (figure below from it.)
A brief but helpful discussion of solar radiation is here.

We are waiting for a clear day to do the sun photometer measurements. Thursday Feb 23rd is forecast to be clear, so prepare for the sunphotometer measurements on that day.
HELPFUL RELATED INFORMATION FOR SUN PHOTOMETER WORK:
Sunphotometer lecture notes.
Presentation on sunphotometers and solar radiation.
Example of sunphotometer measurements on 27 June 2007.
Week 4: 13 February
We will continue a basic circuit laboratory together.This week we concentrate on:
A. Operational amplifier use as a transimpedance amplifier.
B. Circuit schematic and board layout software introduction. You can/should install the free software on your computer. You can bring it to class. This portion of the class turns out to be exceedingly useful.
C. Sunphotometer schematic and circuit board layout.
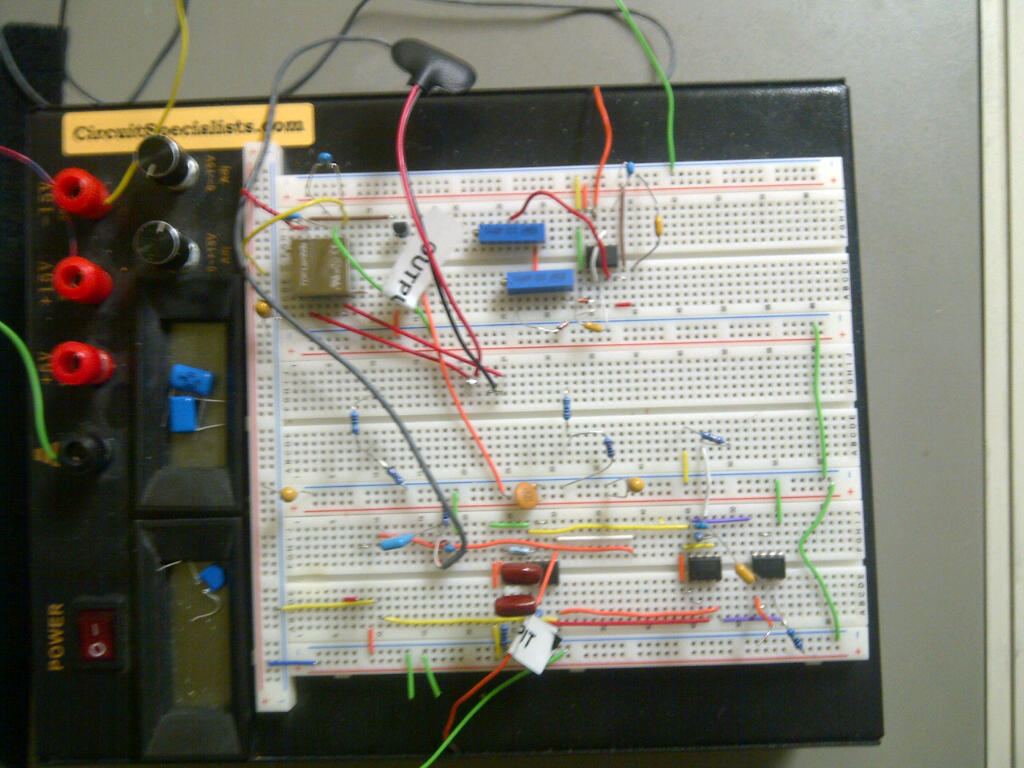
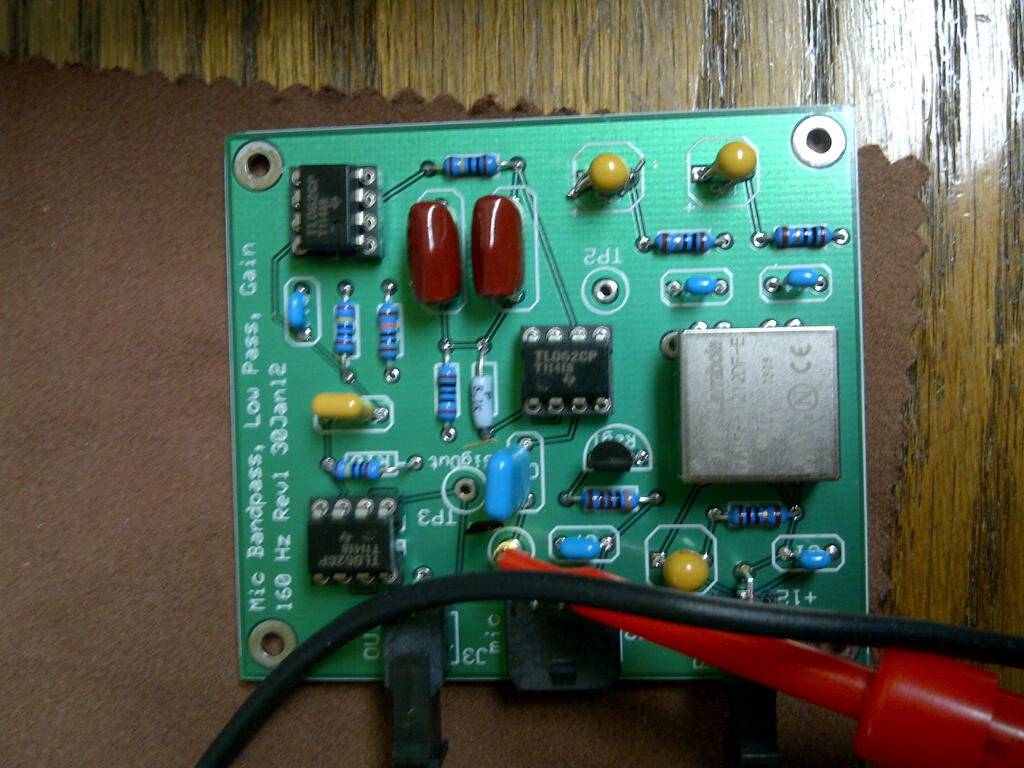
EXAMPLE OF CIRCUIT BOARD DEVELOPMENT:
Schematic
Breadboard
Circuit board
Our goal is to understand how the hand held LED sunphotometers work.
READ: Basic operational amplifier theory.
FROM LAST WEEK:READ: Here is the section on semiconductors and LEDs. The section continues here.
The subject this week is optoelectronics - interaction of light with electronic circuits.
How diodes work.
How LEDs work.
Week 3: 7 February
We will continue a basic circuit laboratory together. (see homework for the reading assignment).
READ: Here is the section on semiconductors and LEDs. The section continues here.The subject this week is optoelectronics - interaction of light with electronic circuits.
How diodes work.
How LEDs work.
Week 2: 30 January
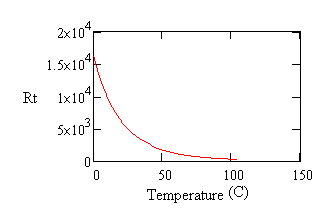
We will continue a basic circuit laboratory together. (see homework for the reading assignment).Thermistors. We will calibrate them and use them for temperature measurements.
Calibrate using ice and water bath, room temperature, body temperature.
Prepare one thermistor for use with a moistened cloth over it for doing a wet bulb measurement.
Go outside, measure the air temperature and wet bulb temperature using the thermistor.
Compare the thermistor measurement of outside temperature with the 'standard instrument'.
Calculate and look up the relative humidity from a table or website below, and compare with the UNR weather station RH.
Bonus: use an ambient pressure of 850 mb: Use a skew-T LogP chart to obtain the Lifting Condensation Level.
Add this section to your notebook under Lab 1.
Discuss uncertainties.
Advanced: Notice from the 'useful site for calibrating thermistors' below that a voltage divider can simply thermistor use.Wet bulb, dry bulb calculator for calculating relative humidity during the thermistor measurements.
Useful site for calibrating thermistors. (offline backup).
Here is a typical thermistor curve from this site.
Review: Resistor Color Code.
Future: Basic operational amplifier theory.
Week 1: 23 January
Three places to learn about what is going on in this class:
Daily Notes (here).
Homework.
Calendar.
Syllabus. (see homework for the notebook description).
We will do a basic circuit laboratory together. (see homework for the reading assignment).
Resistor Color Code.
Basic operational amplifier theory.
Thermistors.a) Basic Circuits Laboratory: Purpose - Nearly all instruments use electronics and electornic circuits. Basic familiarity with circuits can be helpful for understanding and diagnosing instrument performance. Instrument development often has a huge component assocaited with circuit development.
b) Instrument Development: Develop sensors for use on the Mechanical Engineering Dept ultrahigh balloon sounding system, sensors such as particle, trace gas, pressure, temperature, RH, etc, and all. 6 lbs max payload weight. Uses Arduinos (and other) microcontrollers and small, compact systems.
c) Sunphotometer: Purpose - 1. Compare spectral measurements of optical depth (our spectrometer) with CIMEL sunphotometer. 2. Do off sun measurements to get the scattering contribution by aerosol (and gases) and to compute the volume aerosol size distribution, refractive index, and single scattering albedo. 3. Do moon photometery to measure the atmospheric optical depth at night using the moon (or stars) as a source.
d) Soundings: Purpose - 1. Compare balloon soundings with model soundings, (and others) 2. Compare precipitable water from model with measurements. 3. Compare precipitable water with IR thermometer measurements. 4. Plot 3D time and height graphs for the vertical distribution of density, RH, temperature, wind, etc, from data obtained from the model soundings. Develop/use Matlab code.
e) Air Motions: Use the ultrasonic anemometer to characterize the winds on the top of the Physics building. Compare with the UNR weather station, DRI, and Galena weather stations.
f) Weather Radar: Current capabilities of the NWS NEXRAD radar. Future systems.
g) Infrared Spectroscopy: Measure and interpret the downwelling IR radiation using our FTIR, using the UNR weather station IR sensor output, and using hand held thermometers for measurements.
h) In Situ Aerosol and Gaseous pollution: Measure gaseous and particle air pollution in the Reno boundary layer (where we live). May also do electron microscopy of particles, as well as particle size distribution measurements. Role of secondary aerosol? Hygroscopicity of aerosol and aerosol rain out? Air pollution during heavy inversions? Properties of 'fresh' and 'aged' air pollution?
i) Raman Spectroscopy: Study the Raman spectra of atmospheric aerosol. Work to develop a system to do so. Use a 532 nm laser source, and a filter to block its reflection, and then use a spectrometer to quantify Raman spectra. Interpret the spectra. First measure aerosol on filters. Then see if the measurement can be done truly in situ as an added channel to the photoacoustic instrumentation.
ALL WILL WORK TOGETHER FOR A COMMON PURPOSE: To study the atmosphere from many perspectives!