Week 9: 25 March
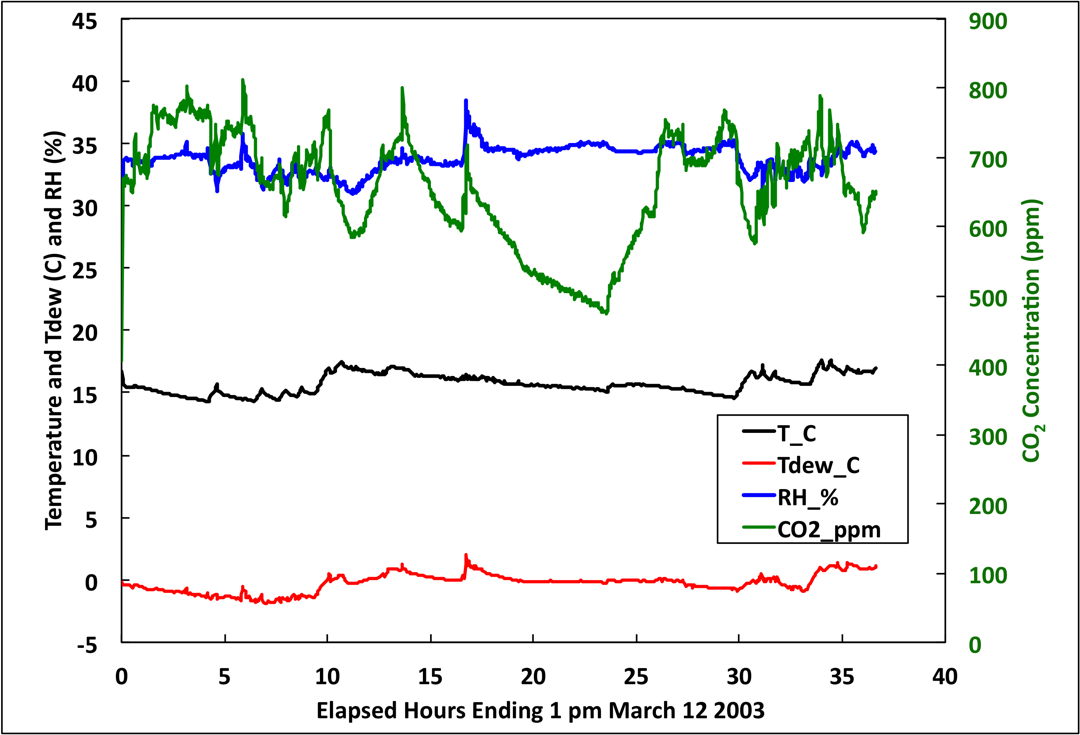
Plot the results of your CO2 sampling over the week of spring break. Interpret it.
We are entering the intense project phase of the course: Projects include:
Project 1. Ultrasonic anemometer, IR irradiance detector, RH detector, and aerosol light absorption and scattering detector
to study cases, especially at night, where various amounts of
turbulence is in the atmosphere. The IR detector (from the UNR
weather station) is used along with the RH and temperature sensors to
calculate how much IR radiation one would expect on a clear night/day,
and thus if there is excess IR radiation, ascribe it to clouds.
Then use the ultrasonic anemometer to see if nocturnal turbulence is
increased
presence of clouds (both with frontal passage and not). The
aerosol measurements are used to judge the end product of atmsopheric
stagnation, pollution buildup.
Project 2.
Albedo measurement for snow and other surfaces using the 2 spectrometer
system. You will need to learn how to run the spectrometers
with the netbook and how to compute albedos relative to the albedo of
the Teflon(trademark) target we use for calibration. The science
goal
is to catalog the albedo of different surfaces and to study snow albedo effects from material embedded in the snow.
Here are some preliminary measurements that were done with the instrument at Tahoe Meadows in Feb 2013.
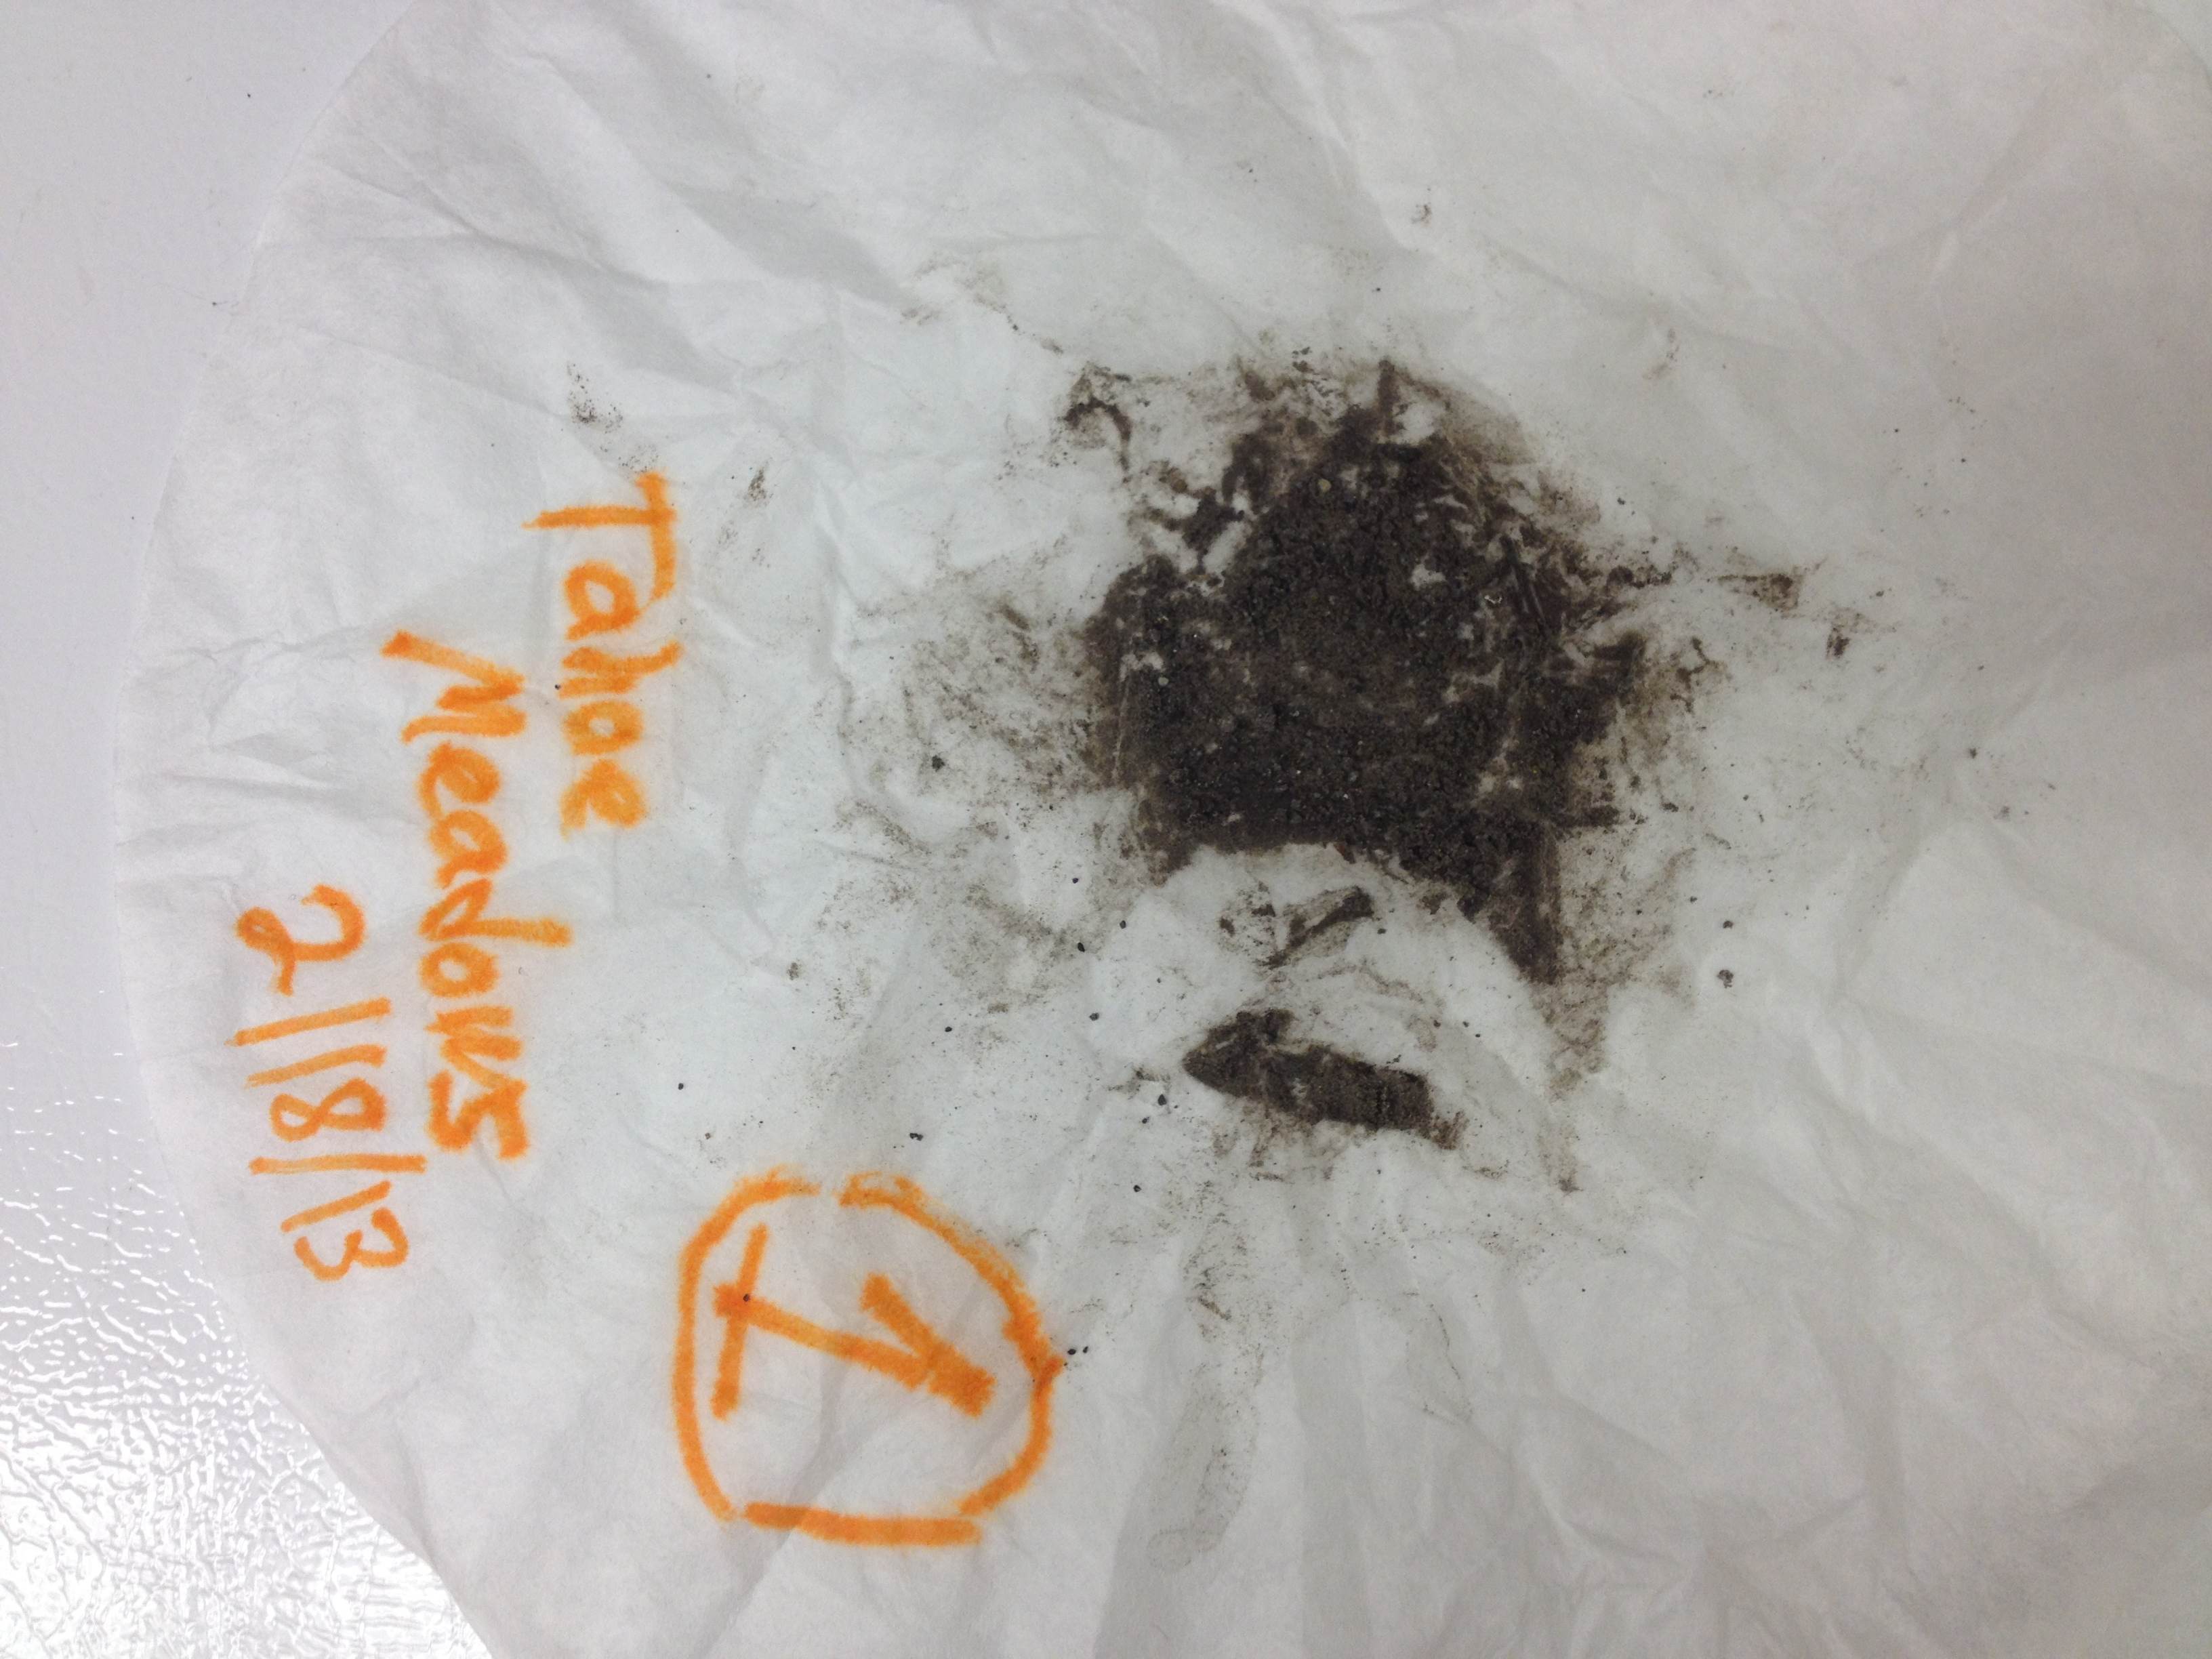
Coffee filter collection of impurities in the snow collected from Tahoe Meadows. It is mostly road dust from transport of
ground gravel used to improve traction for vehicles travelling on the Mt Rose highway.
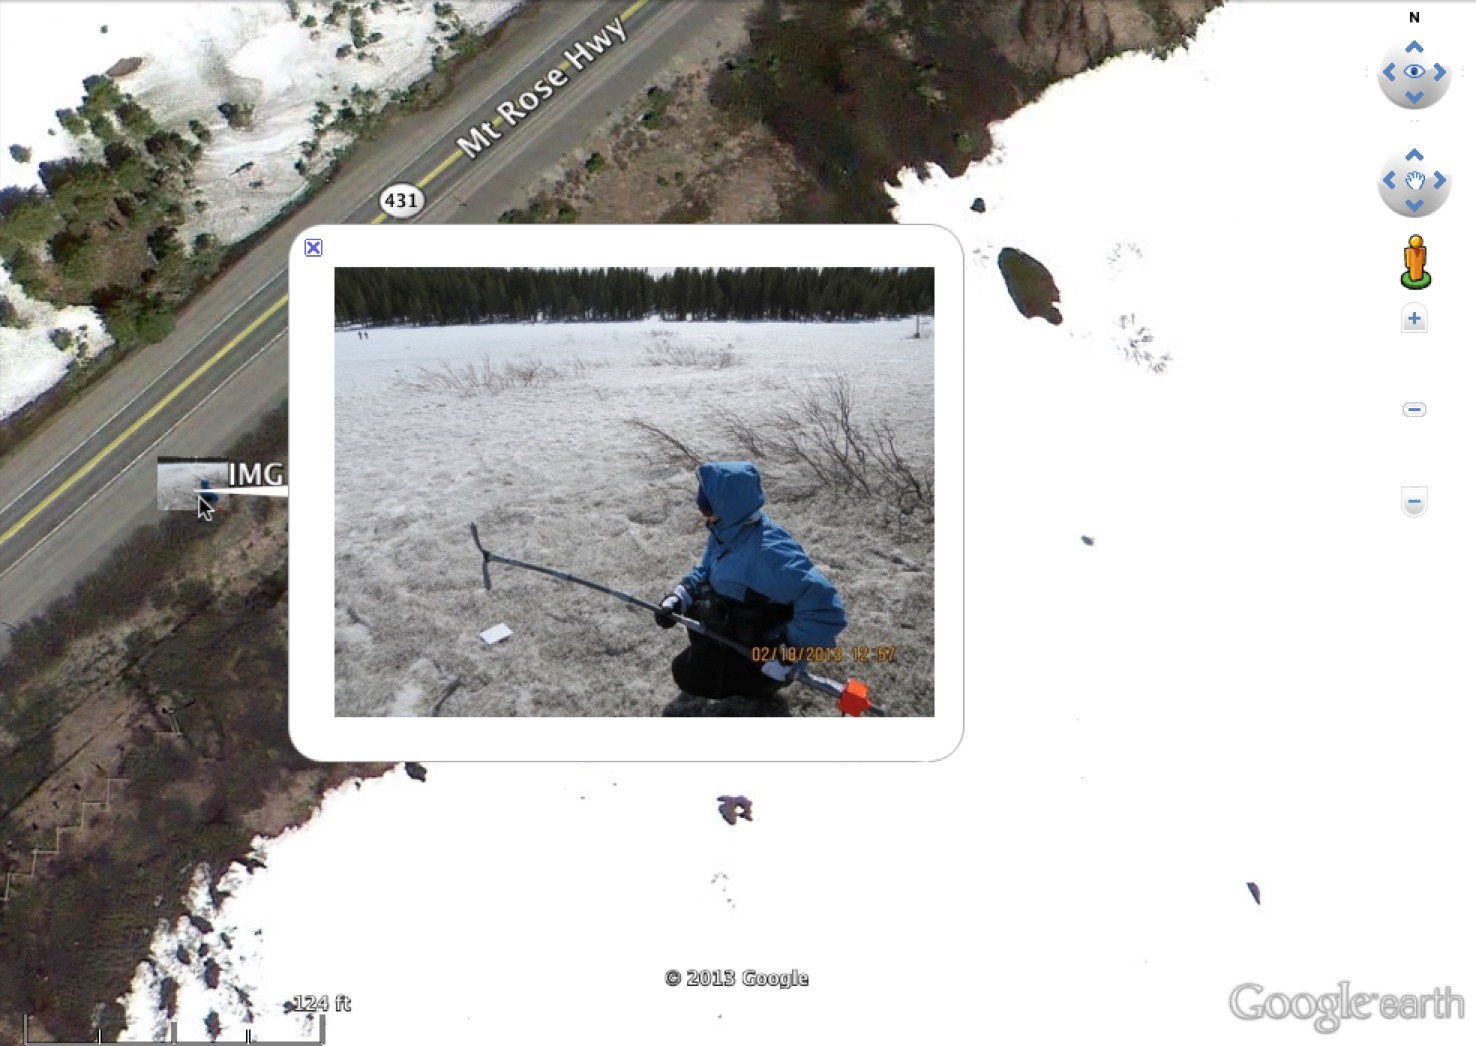
Image from Google Earth of the general area where the snow albedo measurements were obtained. The inset
image shows a student, Sue Konkol, doing measurements of snow albedo with the dual spectrometer system.
Note that the snow in the student image is quite dark near the roadway, but that closer to the trees, and further
from the road, the snow is less impacted by road traffic. Measurements were obtained at various distances from
the road, and preliminary results are shown in the next movie.
PROJECT 3.
Use the spectrometer with an irradiance detector head to measure the total and diffuse radiation in the
atmosphere (so that the instrument is used like a spectrometer based MFRSR). You will be able to get
cloud optical depth as well as aerosol optical depth, and use on a clear day will allow you to absolutely
calibrate the measurements as we have done for sunphotometers using Langley regression.
Here are four papers on the MFRSR. Paper 1. Paper 2. Paper 3. Paper 4.
PROJECT 4.
Air piano and rain detector. Rain falling through a region between detectors will block some of the radiation
and the instrument will respond by playing a musical note(s). The instrument will also be used as a air piano
where the fingers can be used to block some of the radiation and induce a note(s) to be played.
Week 8: 11 March
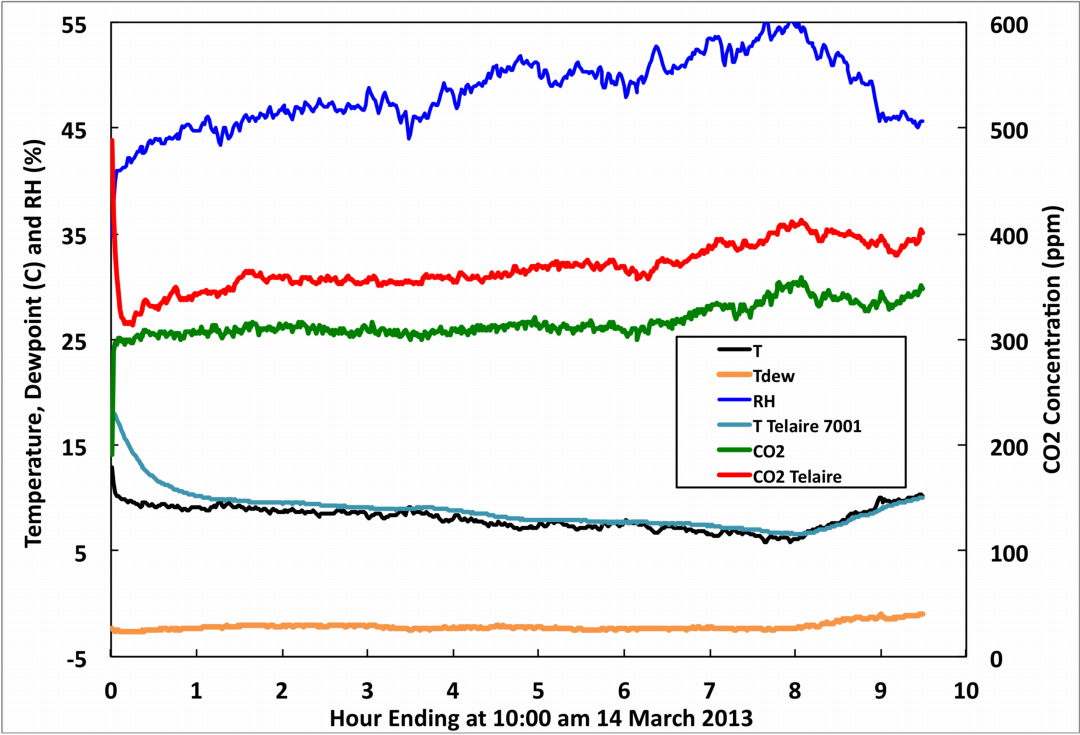
Comparison of temperature from the SHT75 sensor with the Telaire 7001, and the CO2 sensor with the Telaire 7001.
BE SURE YOU CAN MAKE GRAPHS LIKE THIS. The only problem with this style is that I used colors and
a fraction of the population has difficulty seeing colors.
Continue
to develop Arduino-based data logger for battery operated measurements
of carbon dioxide, relative humidity, and temperature.
GROUPS:
1. Mixing of the nocturnal boundary layer due to updrafts and
downdrafts associated with clouds as diagnosed with the ultrasonic
anemometer,
infrared sensor, temperature, and RH sensors at the Valley Road site, and the photoacoustic instruments.
2.
Spectrometer-based MFRSR made with an integrating sphere equipped a
spectrometer, and use of a sun shadow device for obtaining the
diffuse radiation.
3. Snow sampling in remote locations for chemical and particulate content as it is related to snow albedo.
4. Experiments in incandescence and/or fluorescence detection of aerosol.
5. Air piano (and rainfall detector) prototype development.
Sampling example from inside a house: Note that the 9 volt battery doesn't seem to have enough power to drive the system.
Week 7: 4 March
Postponing sunphotometer measurements and lab 2 until later in the semester.
Develop Arduino-based data logger for battery operated measurements of carbon dioxide, relative humidity, and temperature.
Relative humidity and temperature are measured with the SHT-75 digital sensor shown next. The wire color coding scheme is shown.
Arduino program for doing the SHT75 temperature, RH, and dewpoint temperature logging along with the Telaire 6004 CO2 sensor output.
You will need to install the Sensirion library in the Arduino library folder. If you just want to look at data coming from the SHT75 sensor, this is the
simplest program to use.
The Sparkfun MicroSD card shield is used to store data.
Arduino pin assignments are as follows:
5 Volts - red wire of the CO2 and SHT75 sensors.
Ground -
black wire of the CO2 and SHT75 sensors.
Digital pin 7 - Blue wire (clock) of the SHT75 sensor.
Digital pin 6 - White wire (data) of the SHT75 sensor.
A 10 kOhm resistor pulls up the digital pin 6 to 5 volts. See schematic below for the SHT circuit set up.
Analog in 0 - White wire (analog voltage) of the Telaire 6004 sensor.

Here is a photo of the setup.
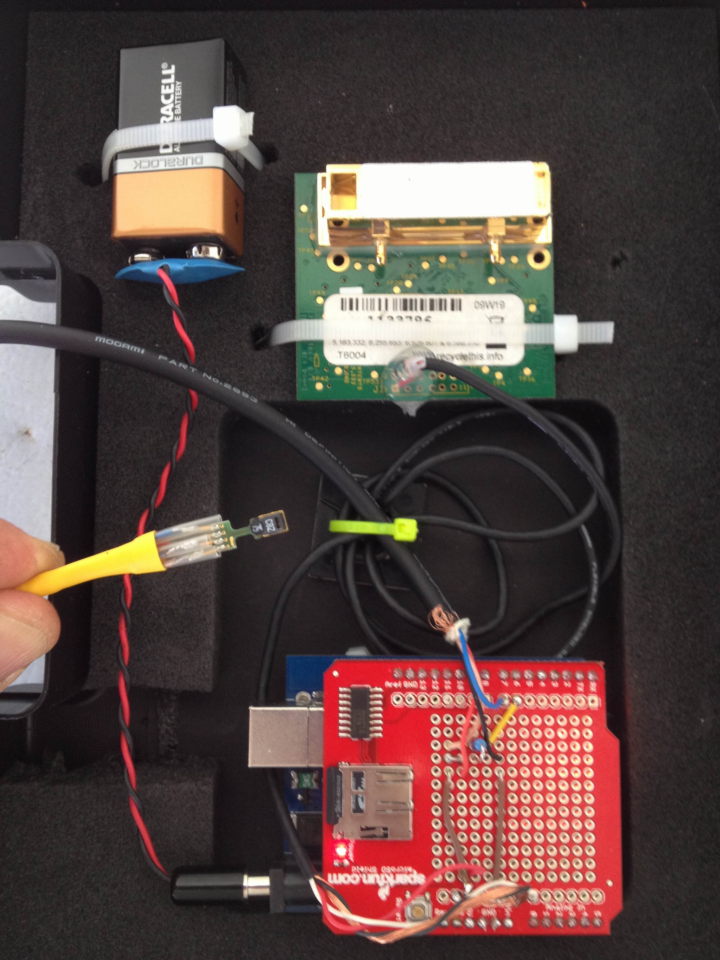
The
Telaire 6004 module description is here: The red wire is 5 volts DC.
The black wire is ground. The analog voltage out is white.
The CO2 concentration can be obtained from the Arduino 10 bit digitizer using
CO2 (ppm) =( Arduino_Counts) * (5 Volts / 1023 Counts) * (2000 ppm / 4 Volts).
The first term in parenthesis is the Arduino counts measured using
analog in 0 channel (with the CO2 sensor white wire attached to it).
The second term converts Arduino counts to actual voltage.
The third term is the conversion factor from measured volts to CO2 concentration in ppm.
We
will package the sensors and Arduino so that you can use them next week
for sampling and logging carbon dioxide concentration, temperature, and
RH. The purpose of this work
is to get used to using
microcontrollers (that you program) to measure atmospheric data from
both analog and digital sensors.
Week 6: 25 February
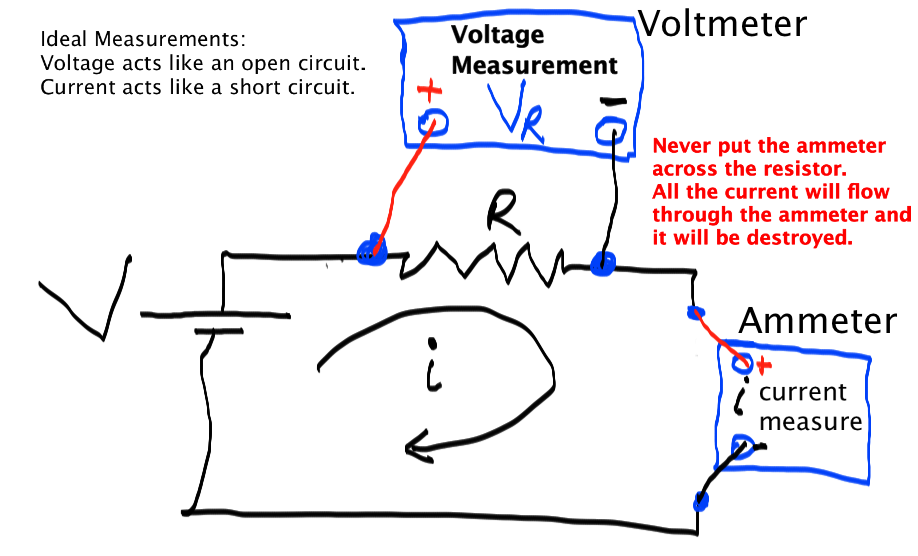
Working on sunphotometer measurements. Continue this week. We will try another measurement method using the inexpensive hand held voltmeters.
They have a 1 Megohm resistor on the input when doing a voltage
measurement; therefore we can obtain the photodiode current amount in
microamps directly
from the voltage measurement, and should have a large enough dynamic range for all instruments.
Lab 2 begins. Sun photometery. See the homework page.
HELPFUL RELATED INFORMATION:
Sunphotometer lecture notes.
Presentation on sunphotometers and solar radiation.
Example of sunphotometer measurements on 27 June 2007.
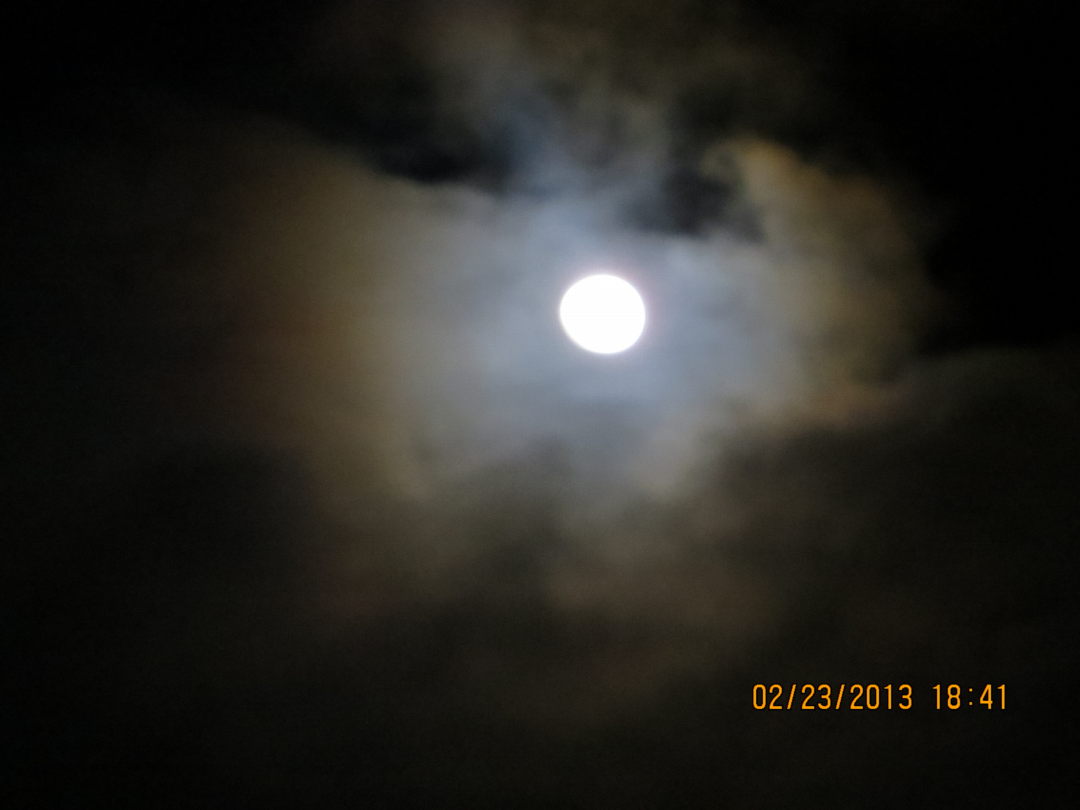
Lunar
corona (diffraction of moonlight by water droplet containing clouds).
Color separation comes from diffraction. The red ring is devoid of blue
light, and is therefore
the first minimum of the diffraction pattern of light diffracted from the droplets in the cloud, at the blue wavelength.
Here is how to interpret the diffraction pattern.
Week 5: 19 February
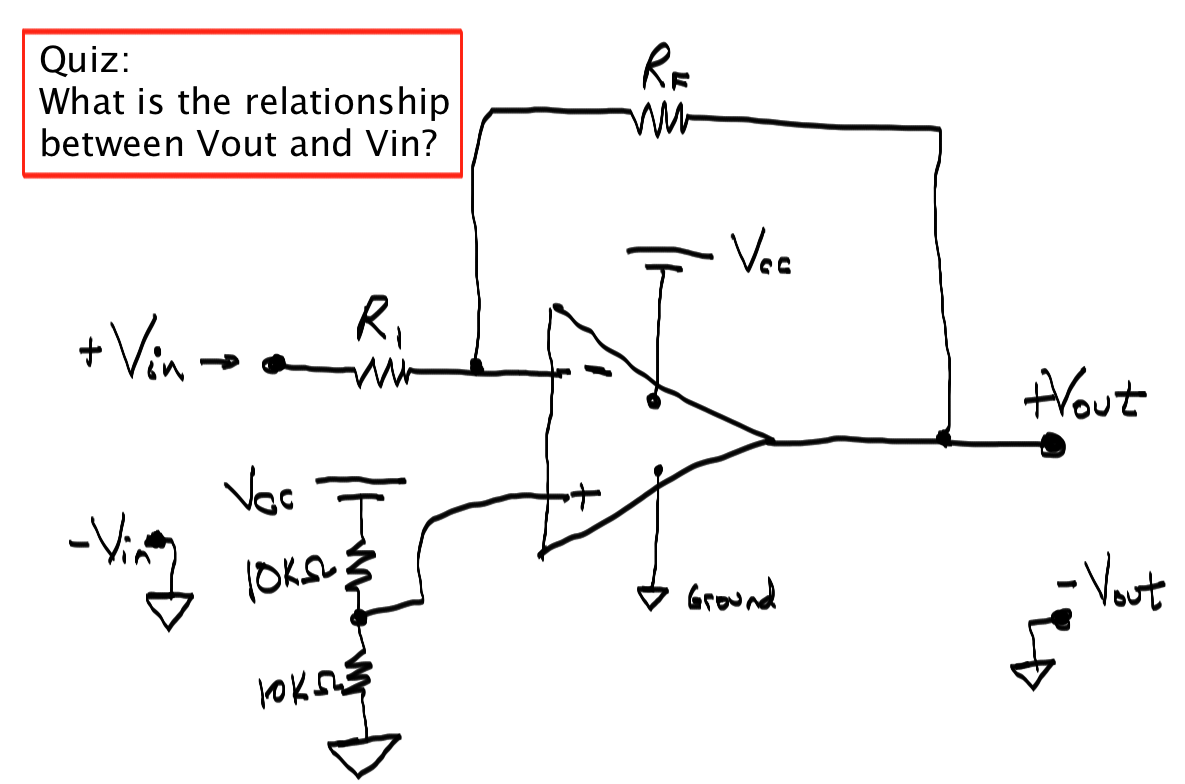
Read the basic operational amplifier theory. You should gain enough skill to analyze a simple op amp circuit.
Prepare lab 1 and your notebook for grading for next Tuesday, February 26th. The lab notebook should be prepared
as a
scientist's portfolio.
Begin thinking of project ideas: so far I have heard of ...
1. Develop O3 sensor for use with Arduino for measurements aloft.
2. Use the spectrometer to measure the spectral total and diffuse irradiance.
Lab 2 begins. Sun photometery. See the homework page.
HELPFUL RELATED INFORMATION:
Sunphotometer lecture notes.
Presentation on sunphotometers and solar radiation.
Example of sunphotometer measurements on 27 June 2007.
Week 4: 11 February
Read the basic operational amplifier theory. You should gain enough skill to analyze a simple op amp circuit.
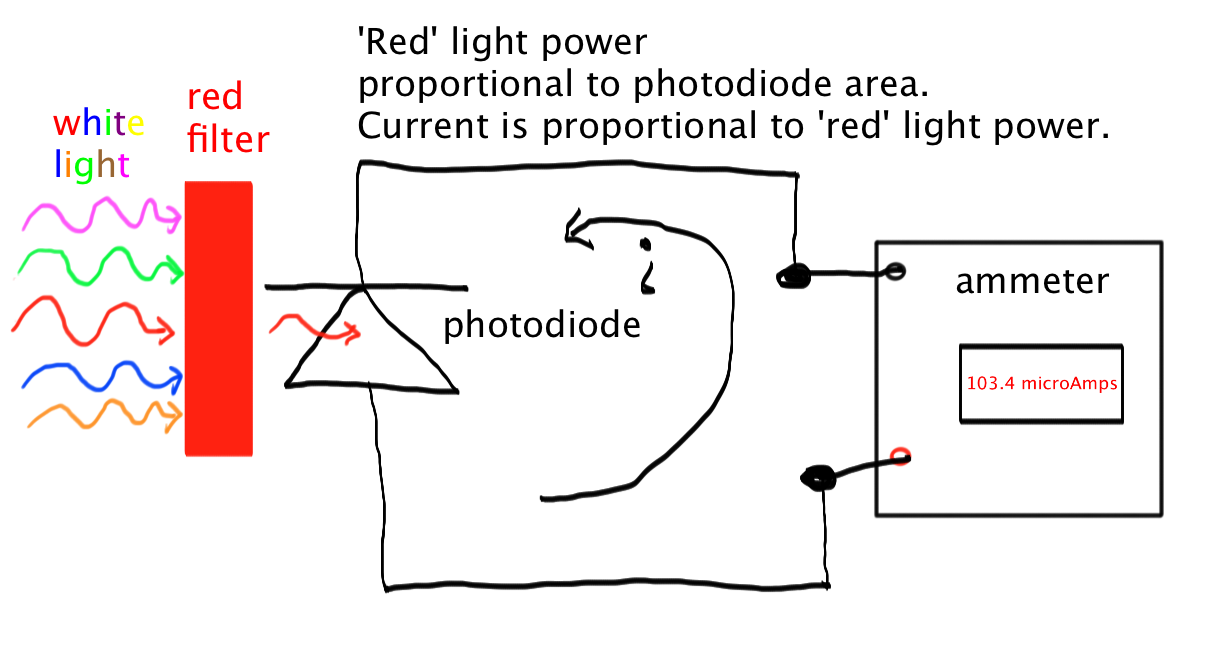
We will look at the opamp as a transimpedance amplifier for photodiodes. The current from the photodiode is
proportional to the incident irradiance. The transimpedance amplifier
converts the current into a voltage, and the output impedance
of the opamp is very low.
We will continue to use the oscilloscopes to analyze the use of photodiodes and opamps to create fast, sensitive photodetectors.
We will continue the basic circuit laboratory together. (see homework for the reading assignment).
Read the basic operational amplifier theory. You should get enough skill to analyze a simple op amp circuit.
Weather permitting we will do sun photometer measurements of the atmosphere on Thursday.
Week 3: 4 February
BRING YOUR FAVORITE LIGHT SOURCE TO CLASS! WE WILL MEASURE SPECTRA OF VARIOUS LIGHT SOURCES.
(Flashlights, LED's, etc.) Movie on how the spectrometer works.
This
week we will use the spectrometers to measure the output of the LEDs
and we will work with photodetectors (circuits and sensors).
You should make a graph of the LEDs you measure and include it in your notebook.
We will continue thebasic circuit laboratory together. (see homework for the reading assignment).
Read the basic operational amplifier theory. You should get enough skill to analyze a simple op amp circuit.
We
also used the digital oscilloscopes to look at and sometimes capture
the time response of LEDs and photodetectors as light detectors.
Related Information.
READ: Here is the section on semiconductors and LEDs. The section continues here.
The subject thursday is optoelectronics - interaction of light with electronic circuits.
How diodes work.
PN Energy Bands.
How LEDs work.
How photodiodes work (from this reference).
Week 2: 28 January
READ: Here is the section on semiconductors and LEDs. The section continues here.
The subject thursday is optoelectronics - interaction of light with electronic circuits.
How diodes work.
How LEDs work.
We will do a basic circuit laboratory together. (see homework for the reading assignment).
Resistor Color Code.
Basic operational amplifier theory.
Thermistors.
Very basic thermistor 'calibration' curve we worked out.
Compare: Platinum resistance temperature detectors.
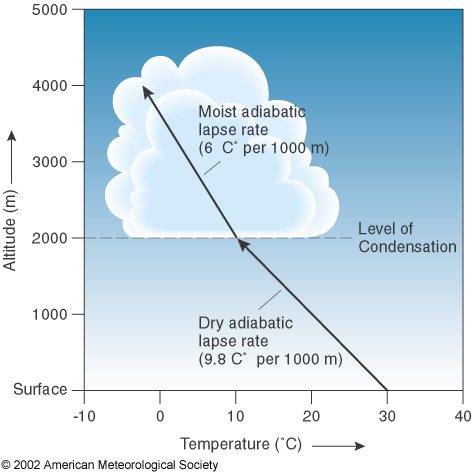
We
will measure temperature and wet bulb temperature. Then we can obtain
the relative humidity and the lifting condensation level.
Useful tools:
1. Humidity calculator.
2. Skew T logP thermodynamic diagram of the atmosphere.
3. Humidity, temperature, saturation, and stability.
4. Lifting condensation level. (next image from here.)
Our own Zach Tolby releasing a weather balloon at the Reno National Weather Service.
Sounding from 4 am 28 January 2013, Reno.
Sounding from August 12, 2012, afternoon at 5 pm local (PDT).
REVIEW FROM LAST TIME:
Three places to learn about what is going on in this class:
Daily Notes (here).
Homework.
Calendar.
Syllabus. (see homework for the notebook description).
Week 1: 21 January
Three places to learn about what is going on in this class:
Daily Notes (here).
Homework.
Calendar.
Syllabus. (see homework for the notebook description).
We will do a basic circuit laboratory together. (see homework for the reading assignment).
Resistor Color Code.
Basic operational amplifier theory.
Thermistors.
LABS:
a) Basic Circuits Laboratory:
Purpose - Nearly all instruments use electronics and electornic
circuits. Basic familiarity with circuits can be helpful for
understanding and diagnosing instrument performance. Instrument
development often has a huge component assocaited with circuit
development.
b) Instrument Development:
Develop sensors for use on the Mechanical Engineering Dept ultrahigh
balloon sounding system, sensors such as particle, trace gas, pressure,
temperature, RH, etc, and all. 6 lbs max payload weight. Uses Arduinos
(and other) microcontrollers and small, compact systems.
c) Sunphotometer:
Purpose - 1. Compare spectral measurements of optical depth (our
spectrometer) with CIMEL sunphotometer. 2. Do off sun measurements to
get the scattering contribution by aerosol (and gases) and to compute
the volume aerosol size distribution, refractive index, and single
scattering albedo. 3. Do moon photometery to measure the atmospheric
optical depth at night using the moon (or stars) as a source.
d) Soundings: Purpose - 1. Compare balloon soundings with model soundings, (and others)
2. Compare precipitable water from model with measurements. 3. Compare
precipitable water with IR thermometer measurements. 4. Plot 3D time
and height graphs for the vertical distribution of density, RH,
temperature, wind, etc, from data obtained from the model soundings.
Develop/use Matlab code.
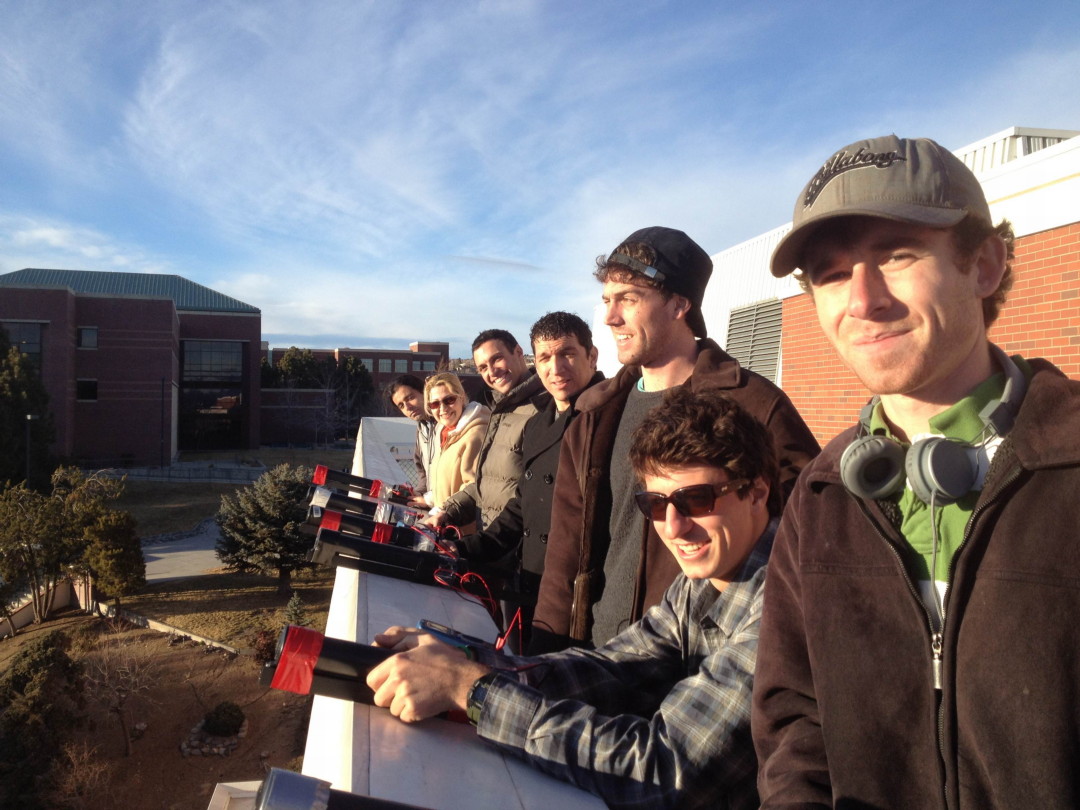
e) Air Motions: Use
the ultrasonic anemometer to characterize the winds on the top of the
Physics building. Compare with the UNR weather station, DRI, and Galena
weather stations.
f) Weather Radar: Current capabilities of the NWS NEXRAD radar. Future systems.
g) Infrared Spectroscopy:
Measure and interpret the downwelling IR radiation using our FTIR,
using the UNR weather station IR sensor output, and using hand held
thermometers for measurements.
h) In Situ Aerosol and Gaseous pollution:
Measure gaseous and particle air pollution in the Reno boundary layer
(where we live). May also do electron microscopy of particles, as well
as particle size distribution measurements. Role of secondary aerosol?
Hygroscopicity of aerosol and aerosol rain out? Air pollution during
heavy inversions? Properties of 'fresh' and 'aged' air pollution?
i) Raman Spectroscopy:
Study the Raman spectra of atmospheric aerosol. Work to develop a
system to do so. Use a 532 nm laser source, and a filter to block its
reflection, and then use a spectrometer to quantify Raman spectra.
Interpret the spectra. First measure aerosol on filters. Then see if
the measurement can be done truly in situ as an added channel to the
photoacoustic instrumentation.
ALL WILL WORK TOGETHER FOR A COMMON PURPOSE: To study the atmosphere from many perspectives!