Week 15: 6 May
Tuesday and Thursday: We will be analyzing the data from last week into a brief report. See the assignment page.
Week 14: 29 April
Thursday:
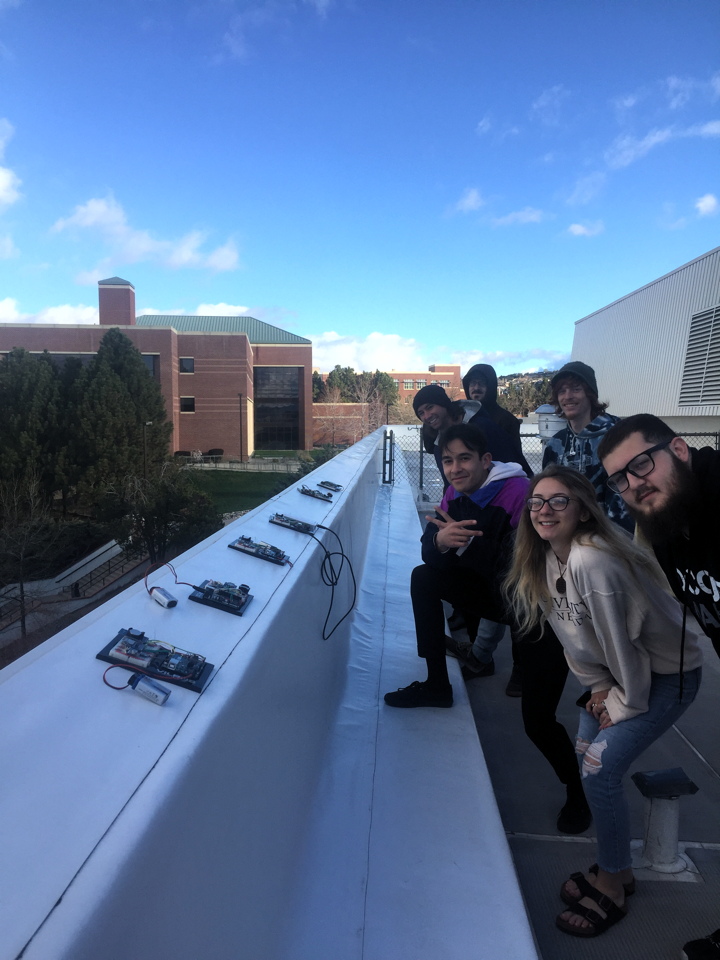
We repeated the measurements from last week. Here are the details.
5/2/2019 Tests Clear Sky Morning. Cool. All times are local daylight time.
Pressure Sensor Test:
7:50:30 Sub basement level (Use this level to get Po and the scale height H).
7:52:30 - 7:52:59 1st floor
7:54:40-7:59:00 4th floor
| Surface | Time When Looking Up | Time When Looking Down at Waist Level | Time With Thermistor Sensor very near the surface |
| Asphalt | 8:03:00 - 8:04:00 | 8:04:20 - 8:05:00 | 8:05:30 - 8:06:30 |
| Concrete | 8:07:20 - 8:08:26 | 8:08:40 - 8:09:22 | 8:09:39 - 8:10:39 |
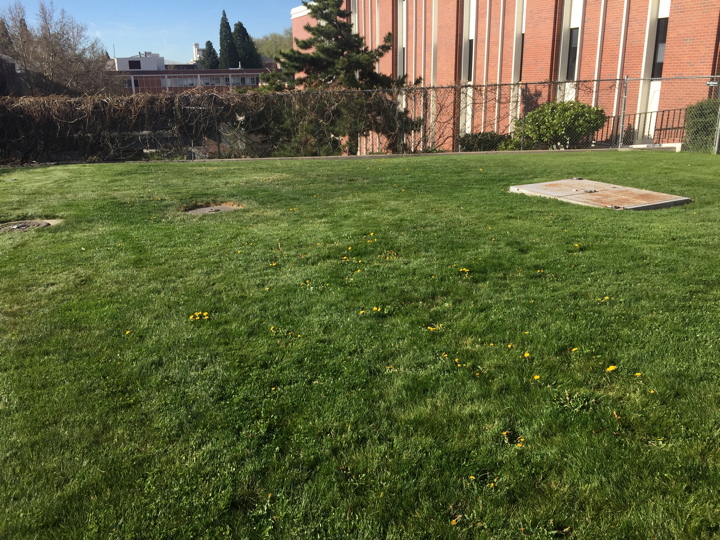
| Grass | 8:12:10 - 8:13:10 | 8:13:20 - 8:14:39 | 8:14:54 - 8:15:54 |
 |
 |
 |
Wall Reflectivity
8:17:20 - 8:18:20 facing wall
8:19:10 - 8:20:10 facing sun
| Total Radiation | 8:22:38 - 8:23:58 |
| Diffuse Radiation (solar sensor shadowed) | 8:25:30 - 8:26:30 |
 |
Tuesday:
We added neutral density filters to the solar sensor. Here's a before and after view.
The sunshade is a punch from a floppy disk, and it was glued on with silicone glue.

We also brought the sonic anemometer outside and did measurements of the gusty wind today.
From last Thursday's class we found that some of the sensors had problems.
The solar sensors saturated in direct sunlight (need to add an attenuator to reduce this effect).
Some of the thermistor sensors were erratic, probably due to the times when measurements were obtained with the sensors upside down (need to investigate).
One of the pressure sensors was erratic.
We will look at methods for improving the sensors and repeat measurements as needed.
The stair well pressure study went well.
Tuesday:
1. We'll make an attenuator for the solar sensor to extend its range for direct sunlight measurements and glue it to the solar sensor.
2. Put the new code on everyone's Arduino.
3. We'll test the code with the serial port viewer.
We will visit and discuss again "significant digits". How to report measurements.
Week 13: 22 April
Tuesday we will prepare the instruments for measurements and do so.
We need to install the most up to date code for the Arduino and need to check the clocks.
Measurements over a variety of surfaces such as asphalt, concrete, grass, soil, etc will include:
- Surface albedo with the solar sensor by measuring looking up, looking down, and taking the ratio.
- Surface temperature measurements with the IR sensor
- Infrared radiation balance by having the IR sensor look down, and look at the sky.
- Do direct and diffuse solar radiation measurements by obtaining total and sun shadowed radiation amounts,
and use the direct radiation amount to estimate atmospheric optical depth at the wavelength of the sensor, 550 nm. - Building height estimate made using the pressure sensor.
Measurements on 4/23/2019:
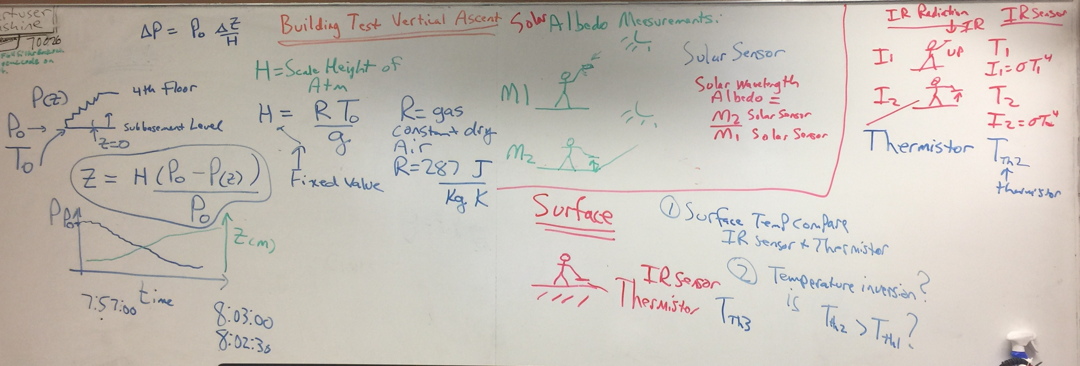
Building Test Vertical Ascent: (need time series of pressure and calibrate to get the height time series)
7:57:00 start in sub basement level
8:00:43 1st floor level
8:02:18 4th floor level
Asphalt:
8:05:00 - 8:07:00 Looking up (calculate downwelling IR; note downwelling solar)
8:08:20 - 8:09:43 Looking down
(calculate upwelling IR; note upwelling solar)
8:10:25 - 8:11:28 1 mm above surface looking down (compare thermistor temperature and IR temperature)
Calculate surface albedo from Albedo=(upwelling solar) /(downwelling solar)
Concrete Sidewalk:
8:12:40-8:13:40
Looking up (calculate downwelling IR; note downwelling solar)
8:14:10-8:15:46 Looking down
(calculate upwelling IR; note upwelling solar)
8:16:02-8:17:02
1 mm above surface looking down (compare thermistor temperature and IR temperature)
Calculate surface albedo from Albedo=(upwelling solar) /(downwelling solar)
Grass:
8:20:20-8:21:20
Looking up (calculate downwelling IR; note downwelling solar)
8:22:00-8:23:22
Looking down
(calculate upwelling IR; note upwelling solar)
8:23:40-8:25:00 1 mm above surface looking down (compare thermistor temperature and IR temperature)
Calculate surface albedo from Albedo=(upwelling solar) /(downwelling solar)
Wall Reflectivity:
8:28:00-8:29:13 Facing directly towards the sun
8:30:00-8:31:00 Facing wall
Calculate wall albedo from the lux sensor using albedo=(Facing Wall)/(Facing directly towards the sun)
Total and Diffuse Solar Radiation Measurements with sensor on the ground:
8:33:00-8:36:00 Total irradiance
8:37:30-8:40:00 Shadowed sensor, diffuse solar radiation measurement
Calculate the ratio of diffuse to total solar radiation
Was the thermistor sensor temperature lower when the sensor was shaded?
 |
 |
 |
 |
 |
 |
 |
 |
|
 |
 |
Week 12: 15 April
Work on Assignment 6 over the weekend and bring questions to class on for Tuesday Class:
Thursday we will likely start a new measurement campaign that we discuss and plan for on Tuesday.
Related information:
Example of how to use equations in Microsoft word.
Week 11: 8 April
Thursday Class:
We will work on the data from Tuesday and last Thursday.
We also will have a discussion of report writing, how to use the equation editor in Word, here's an example.
Note there are keyboard shortcuts for making equations, though they are generally not needed, they make the job easier when you get used to them.
Tuesday and Thursday Class:
NOTE: Assignment 5 is due Sunday 7 April 2019.
We will operate the instrument in the classroom to observe the field of view of the IR sensor.
We should also bring the instrument outside to get data for measuring the response time of the thermistor sensor when going from warm air to cool air (unlike how we did the test in class when we warmed it with our fingers).
We will analyze data from last Thursday's class (see week 10 notes) on Tuesday, and will do more measurements on Thursday.
We will work on assignment 5, to set up the Arduino to do measurements outside.
Regional Weather Stations, including the UNR weather station. We'll get data from the UNR weather station for the data analysis on Tuesday.
| All of the Western Regional Climate Center Weather Sites | click here | |
| LOCAL WEATHER STATION DATA MANAGED BY THE WESTERN REGIONAL CLIMATE CENTER AT DRI PASSWORD IS wrcc14 | SITE DESCRIPTION | Current Data Graphs to see what's going on |
| UNR Weather Station on Valley Road | click here |
click here |
| DRI Weather Station | click here | click here |
| Slide Mountain Weather Station | click here | click here |
Related and interesting information
Geostationary image of clouds, and lenticular clouds.
 |
 |
Week 10: 1 April
Tuesday and Thursday Class:
NOTE: Assignment 5 is due Sunday 7 April 2019.
We will work on assignment 5, to set up the Arduino to do measurements outside.
Everyone should have their instrument together and tested by the end of Tuesday's class.
Thursday we will walk over to the UNR weather station on Valley Road and do measurements.
 |
 |
 |
 |
 |
Week 9: 25 March
Tuesday and Thursday Class:
We will work on assignment 5, to set up the Arduino to do measurements outside.
Week 8: 11 March
Tuesday and Thursday Class:
Turn in Assignment 4 part 2, and prepare for part 3.
We will continue on assignment 4 parts 5 and 6, Arduino measurements of atmospheric properties.
We will work on pressure sensor and IR temperature sensor next, and demonstrate the IR sensor data acquistion with Labview.

Pressure sensor circuit.
Click image for larger version.
Week 7: 4 March
Tuesday and Thursday Class:
Turn in Assignment 4 part 1, and prepare for part 2.
We will continue on assignment 4 parts 3 and 4, Arduino measurements of atmospheric properties.
We will work on the temperature sensors next.
Sign in to Office 365 with your netID and download Office for your home system.
Be sure you are saving documents in your One Drive so you can work on them anywhere.

Thermistor test circuit.
Click image for larger version.
Week 6: 25 February
Tuesday and Thursday Class:
We will continue on assignment 4, Arduino measurements of atmospheric properties.
Be sure to do assignment 3. We will work on the temperature sensor next.
Sign in to Office 365 with your netID and download Office for your home system.
Be sure you are saving documents in your One Drive so you can work on them anywhere.

Updates theory (and schematic)
for obtaining the photoresistor
response time. Click image for
larger version.
Week 5: 18 February
Tuesday and Thursday Class:
We will continue on assignment 4, Arduino measurements of atmospheric properties.
Be sure to do assignment 3.
Sign in to Office 365 with your netID and download Office for your home system.
Be sure you are saving documents in your One Drive so you can work on them anywhere.
Updates theory (and schematic)
for obtaining the photoresistor
response time. Click image for
larger version.
Week 4: 11 February
Tuesday and Thursday Class:
We will continue on assignment 4, Arduino measurements of atmospheric properties.

Schematic and theory for obtaining
the photoresistor response time.
Click image for larger version.
Week 3: 4 February
Tuesday and Thursday Class:
We will continue on assignment 4, Arduino measurements of atmospheric properties.
We worked on obtaining the response time of the photoresistor sensor used to measure light.

Schematic for response time.
Click image for larger version.
Week 2: 29 January
Thursday Class:
Introduced the Arduino IDE and used it to blink the LED.
Changed the blink frequency until the light looked continuous.
Looked at the signal used to drive the LED with the oscilloscope.
Here's the modified Arduino code we developed.
Tuesday Class:
We will continue on assignment 4, Arduino measurements of atmospheric properties.

Note that Assignment 1 is an online assignment, and is due on Sunday night; it's about radar.
We will do Assignment 2 together.
Assignment 3 is also an online assignment.
Pressure measurements of wind speed.
Pitot tube description.
Week 1: 22 January
Thursday Class:
We will start on assignment 4, Arduino measurements, on Thursday.
Note that Assignment 1 is an online assignment, and is due on Sunday night; it's about radar.
We will do Assignment 2 together.
Assignment 3 is also an online assignment.
 Class notes starting with electronics, and path through the skew T diagram. Click image for larger version. |
 Definition of the lines on the skew T to help with understanding how to use it. Click image for larger version. Definition of the lines on the skew T to help with understanding how to use it. Click image for larger version. |
Tuesday Class:
Introductions and orientation.
Three places to learn about what is going on in this class:
Daily Notes (here).
Calendar.
Assignments. Assignment 1 has been posted.
Syllabus.
What measurements are needed for atmospheric measurements?
Temperature and Wetbulb Temperature Measurement
and Quantities Derived From ThemIt's the dry season! And wet season! How can that be?
Relative humidity calculator.
Dewpoint temperature calculator.
Lifting condensation level calculator.
Air temperature in room =
Wet bulb temperature in room =
Dew point temperature in room =
Calculated relative humidity =
Water vapor to air mixing ratio =
Lifting condensation level pressure =
Lifting condensation level temperature =
Surface pressure =
Lifting condensation level height =Skew T log P graph as a gif file, and in a presentation.
Pressure measurements of wind speed.
Pitot tube description.