Week 15 5 May
PREPARE FOR THE FINAL EXAM:
15 minute presentation on your last lab.
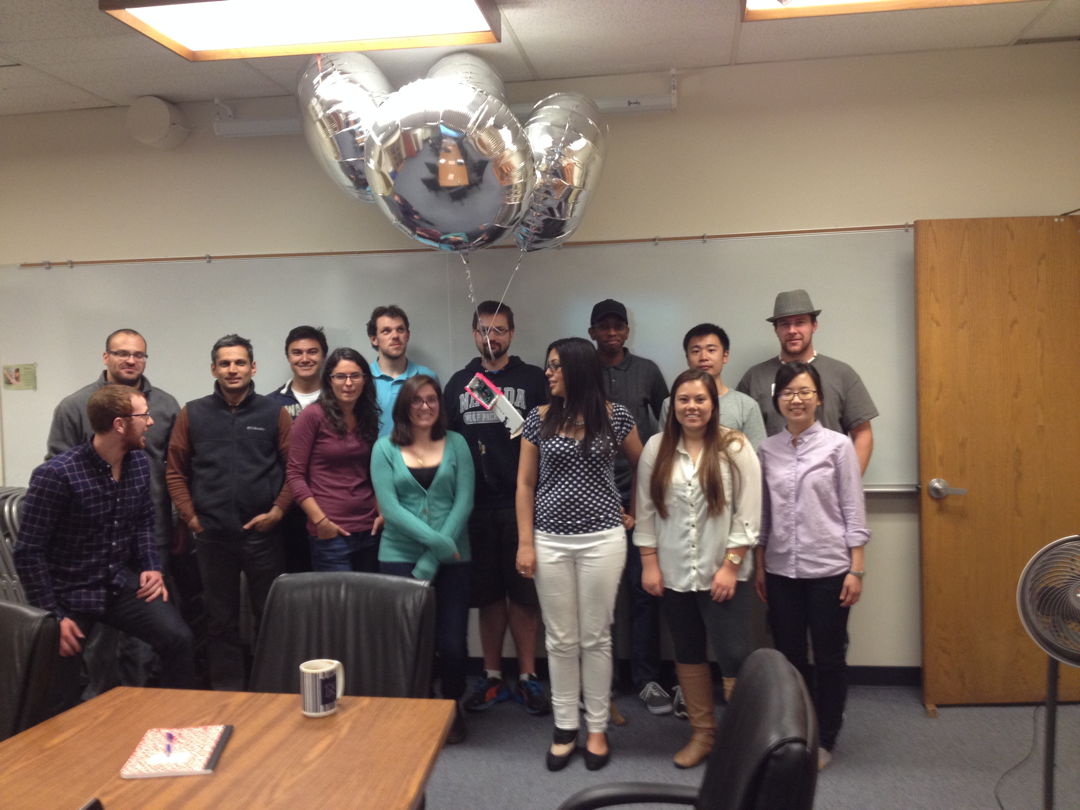
The balloon launch was very successful. Most students were present at 4 a.m. Narayan performed FTIR measurements of the downwelling infrared radiation to measure the vertical distribution of temperature in the boundary layer. Balloon soundings were made with the tethered balloon system to a height of about 100 meters. Temperature, relative humidity, pressure, and carbon dioxide concentration were all measured. The results were very interesting. See this presentation for an initial summary of results. By the way, thanks to Jayne for bringing donuts.
Congratulations class of 2014 on an excellent semester filled with strong accomplishments and very insightful learning experiences!
Final Presentations:
Photoacoustic and air pollution group studied November 2013
Air motions group studied the Rim fire of August 2013
Surface albedo group studied dynamics of wet and dry soils
FTIR group studied afternoon clear sky conditions and compared measurements with the line by line radiative transfer model. They also reported on the balloon sounding experiment.
The electronics group presented ground based measurements of temperature, pressure, RH, and CO2 concentration in two parts: part 1, part 2.
The second part of the electronics group demonstrated an instrumentation package for monitoring high performance skate boards and other systems.
Week 14 28 April
PREPARE FOR THE FINAL EXAM:
15 minute presentation on your last lab.
Groups are continuing to work on period 5; Labs are due on Tuesday. Two groups
did an experiment at the UNR Valley Road weather station (albedo of
soil moist and dry; soil temperature moist and dry; spectral
diffuse and direct downwelling irradiance; and all of the weather
station data, including subsurface soil temperature). Sunphotometer group needs to model (using SMARTS)
the downwelling direct and diffuse and compute and measure its ratio as
a function of aerosol optical depth for urban aerosol and desert dust
aerosol, to see which model fits best. Clear sky data should be
acquired as well.
The FTIR group will compare measurements and simulations for morning and afternoon soundings.

Electronics Section:
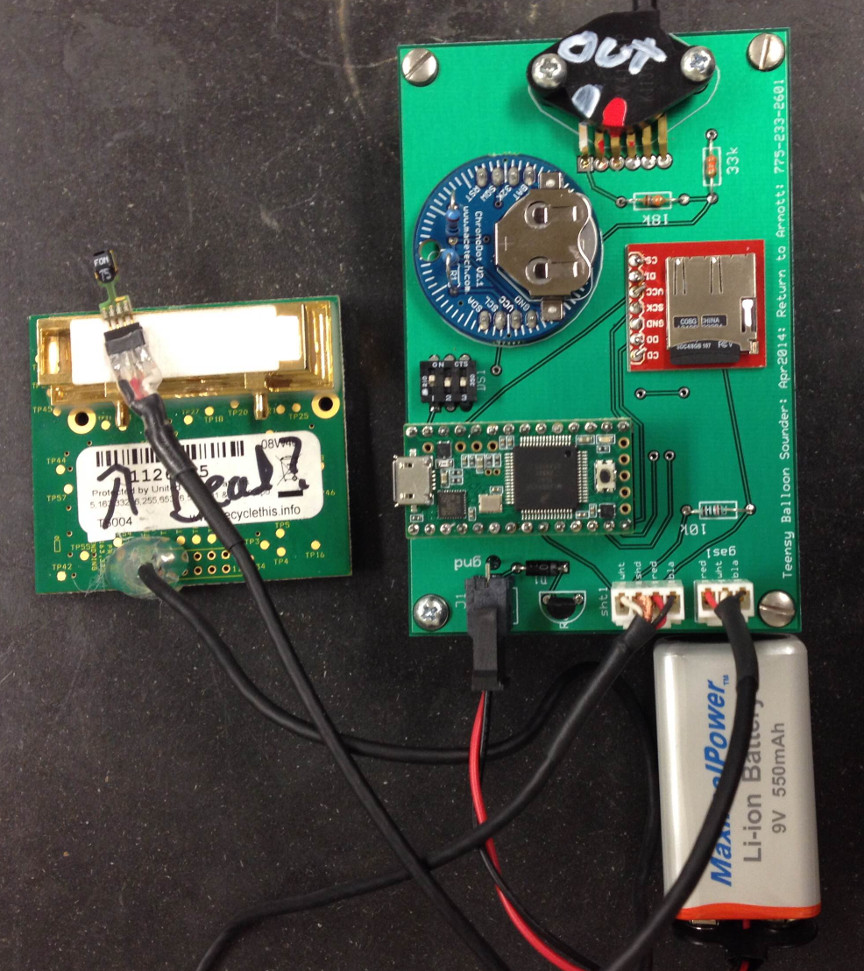
Here is the Teensy 3.0 code for setting the time with the real time clock. Let us use the Chronodot for time keeping; it has proven to work well. Here is the Chronodot Set Code and test code. We now must move forward aggressively to finish the sensor package for the balloon sounding. Here is the website for the Chronodot use on the Teensy (Pullup resistors are needed; see the site.) Here is the data sheet for the real time clock used on the Chronodot.
Draft schematic for the board we need for sampling is here.
Draft PCB layout for the board is here (check both for correctness by breadboarding up the schematic and checking it.)
Teensy code for the data logger (draft -- check it out).
The boards have arrived: Students need to put their board together and test it, in preparation for the balloon flights.
Week 13 21 April
Groups are continuing to work on period 5; Two groups did an experiment at the UNR Valley Road weather station (albedo of soil moist and dry; soil temperature
moist and dry; spectral diffuse and direct downwelling irradiance; and all of the weather station data, including subsurface soil temperature) .
Sunphotometer group needs to model (using SMARTS) the downwelling direct and diffuse and compute and measure its ratio as a function of aerosol optical depth for
urban aerosol and desert dust aerosol, to see which model fits best. Clear sky data should be acquired as well.
The FTIR group will compare measurements and simulations for morning and afternoon soundings.Electronics Section:
Here is the Teensy 3.0 code for setting the time with the real time clock. Let us use the Chronodot for time keeping; it has proven to work well. Here is the Chronodot Set Code and test code. We now must move forward aggressively to finish the sensor package for the balloon sounding. Here is the website for the Chronodot use on the Teensy (Pullup resistors are needed; see the site.) Here is the data sheet for the real time clock used on the Chronodot.Draft schematic for the board we need for sampling is here.
Draft PCB layout for the board is here (check both for correctness by breadboarding up the schematic and checking it.)
Teensy code for the data logger (draft -- check it out).
Week 12 14 April
Groups are continuing to work on period 5; Two groups did an experiment at the UNR Valley Road weather station (albedo of soil moist and dry; soil temperature
moist and dry; spectral diffuse and direct downwelling irradiance; and all of the weather station data, including subsurface soil temperature) .
Sunphotometer group needs to model (using SMARTS) the downwelling direct and diffuse and compute and measure its ratio as a function of aerosol optical depth for
urban aerosol and desert dust aerosol, to see which model fits best. Clear sky data should be acquired as well.
The FTIR group will compare measurements and simulations for morning and afternoon soundings.Electronics Section:
Here is the Teensy 3.0 code for setting the time with the real time clock. We are working toward finishing the sensor package for the balloon sounding.
Week 11: 7 April
Groups are continuing to work on period 4; labs are due on Thursday. Be prepared for new measurements for period 5 on Thursday, especially if we have a nice day.
The FTIR lab now will incorporate use of the clear sky spectrum calculation.
The optical spectrometer and sunphotometer lab will now make use of the DOE SMARTS simulation software to simulate direct and diffuse radiation amounts,
to get that ratio for comparison with measurements.Electronics Section:
We have identified a joint group project to use a tethered balloon to carry a measurement payload into the atmospheric boundary layer for measurements of temperature, RH, CO2 concentration, and aerosol concentration. The science objectives are to characterize temperature inversions (cold at the surface, warmer aloft) and how they dissipate after sunrise. Temperature inversions are associated with extremely stable, stagnant air near the surface. We want to find out if the CO2 concentration builds up in a layered fashion near the surface. The in situ sampling will provide data for use in evaluating retrievals of temperature and relative humidity accomplished using the FTIR spectrometer that measures the downwelling infrared radiation emitted by greenhouse gases and clouds.Here is the Arduino code we wrote last year for measurement of CO2, T, and RH using the Telaire sensor, and the SHT75 temperature and RH sensor.
Here is some Arduino code that includes the Freescale MPX4115AP pressure transducer as well as CO2, T, and RH using the Telaire sensor, and the SHT75 temperature and RH sensor.
Here are the libraries used for the Arduino code.Data sheets:
CO2 sensor
SHT75 Temperature and RH
Sharp particle sensor GP2Y1010AU0F
Intel Galileo microcontroller (2014)
Freescale MPX4115AP pressure transducer description and application note. Application note has good hints for circuit board layout.
Here is the manual for the Telaire 7001 product for comparison with our development.
Week 10: 31 March
Groups are continuing to work on period 4; labs are due on Thursday. Be prepared for new measurements for period 5 on Thursday, especially if we have a nice day.
The FTIR lab now will incorporate use of the clear sky spectrum calculation.
The optical spectrometer and sunphotometer lab will now make use of the DOE SMARTS simulation software to simulate direct and diffuse radiation amounts,
to get that ratio for comparison with measurements.Electronics Section:
We have identified a joint group project to use a tethered balloon to carry a measurement payload into the atmospheric boundary layer for measurements of temperature, RH, CO2 concentration, and aerosol concentration. The science objectives are to characterize temperature inversions (cold at the surface, warmer aloft) and how they dissipate after sunrise. Temperature inversions are associated with extremely stable, stagnant air near the surface. We want to find out if the CO2 concentration builds up in a layered fashion near the surface. The in situ sampling will provide data for use in evaluating retrievals of temperature and relative humidity accomplished using the FTIR spectrometer that measures the downwelling infrared radiation emitted by greenhouse gases and clouds.Here is the Arduino code we wrote last year for measurement of CO2, T, and RH using the Telaire sensor, and the SHT75 temperature and RH sensor.
Data sheets:
CO2 sensor
SHT75 Temperature and RH
Sharp particle sensor GP2Y1010AU0F
Intel Galileo microcontroller (2014)
Freescale MPX4115AP pressure transducer description and application note. Application note has good hints for circuit board layout.
Week 9: 24 March
Groups are continuing to work on period 3; labs are due on Thursday. Be prepared for new measurements for period 4 on Thursday, especially if we have a nice day.
The FTIR lab now will incorporate use of the clear sky spectrum calculation.
The optical spectrometer and sunphotometer lab will now make use of the DOE SMARTS simulation software to simulate direct and diffuse radiation amounts,
to get that ratio for comparison with measurements.Electronics Section:
We are entering project phases. We have roughly 3 ideas to consider: instrumenting a skateboard up with speed, accelleration, and location; an optical, synthesized sound system; an ultrasonic analog to the Very Large Array radio telescope, demonstrating use in range finding as well.Here is an example of an optical component that could be useful.
Week 8: 10 March
Groups are continuing to work on period 3; labs are due on Thursday. Be prepared for new measurements for period 4 on Thursday, especially if we have a nice day.
The FTIR lab now will incorporate use of the clear sky spectrum calculation.
The optical spectrometer and sunphotometer lab will now make use of the DOE SMARTS simulation software to simulate direct and diffuse radiation amounts,
to get that ratio for comparison with measurements.Electronics Section:
Learn how to do circuit board layout for both through hole and surface mount components using the express pcb software.
Will work on the 'pulse measuring lab' in the Evil Genius textbook.
Week 7: 3 March
Groups are continuing to work on period 3.
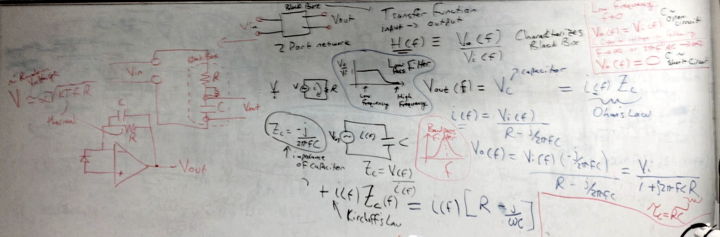
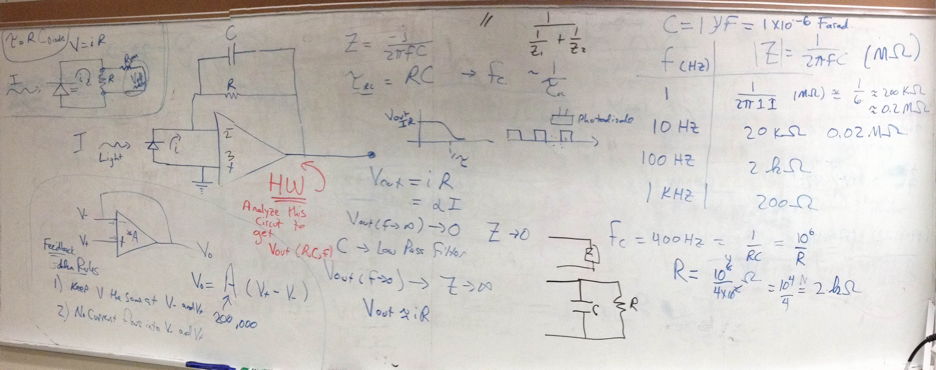
Electronics Section: Turn in the homework assignment on the transimpedance amplifier circuit on Tuesday.
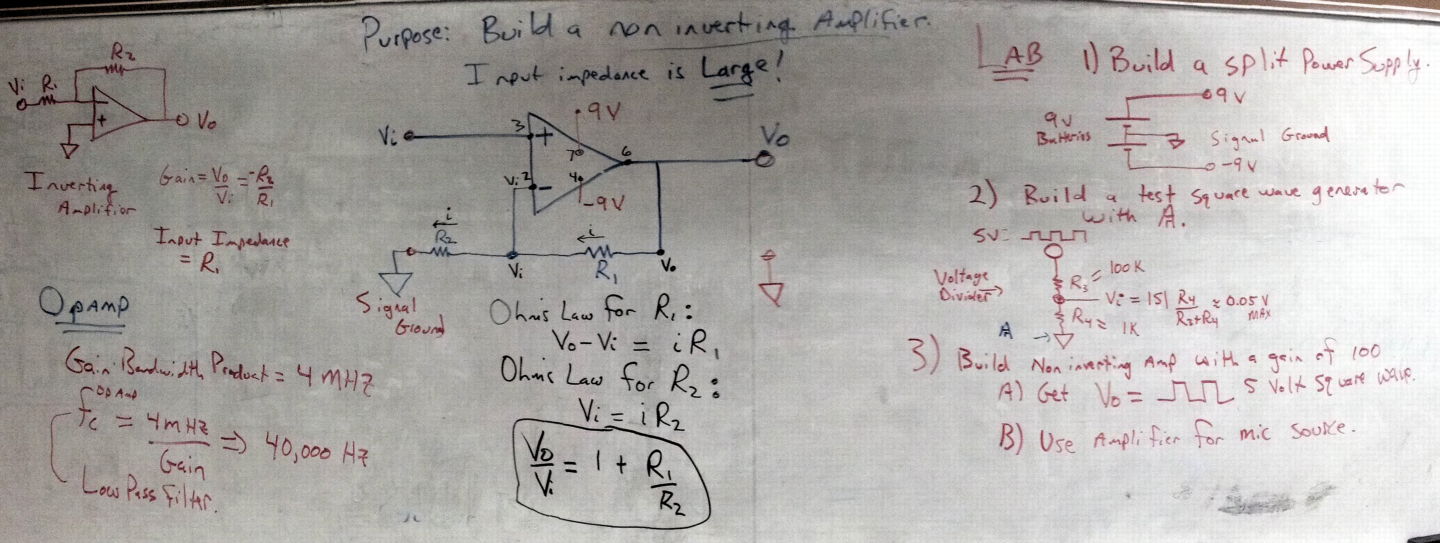
Worked through the theory of non inverting amplifiers, their advantanges, and had students build one, providing a gain of 100.
Looked closely at the gain-bandwidth product of the op amp and the limits it places on the frequency response of the amplifier.
Added a low pass filter to the input and output of the amplifier to illustrate stronger filter than one RC filter; achieved a sine wave output for a square wave input by absorbing higher harmonics.
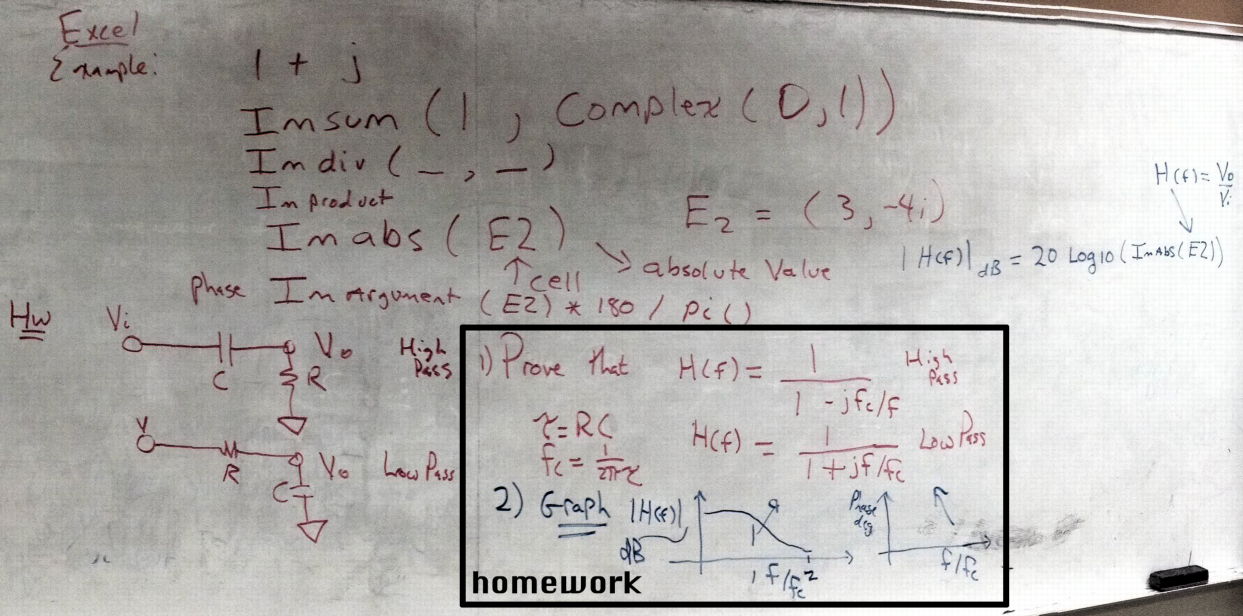
Turned in a homework assignment detailing the computed frequency response of RC low and high pass filters.
Learned how to do circuit schematic development using the express pcb software.
Week 6: 24 February
The second lab will be turned in on Tuesday. Group assignments will change.
Electronics Section: Turn in the homework assignment on the transimpedance amplifier circuit on Tuesday.
We will work with software for preparing circuit schematics, and for doing circuit board layouts.
We will continue to work with opamps and detection of light this week, and use of the Arduinos for multiple functions.
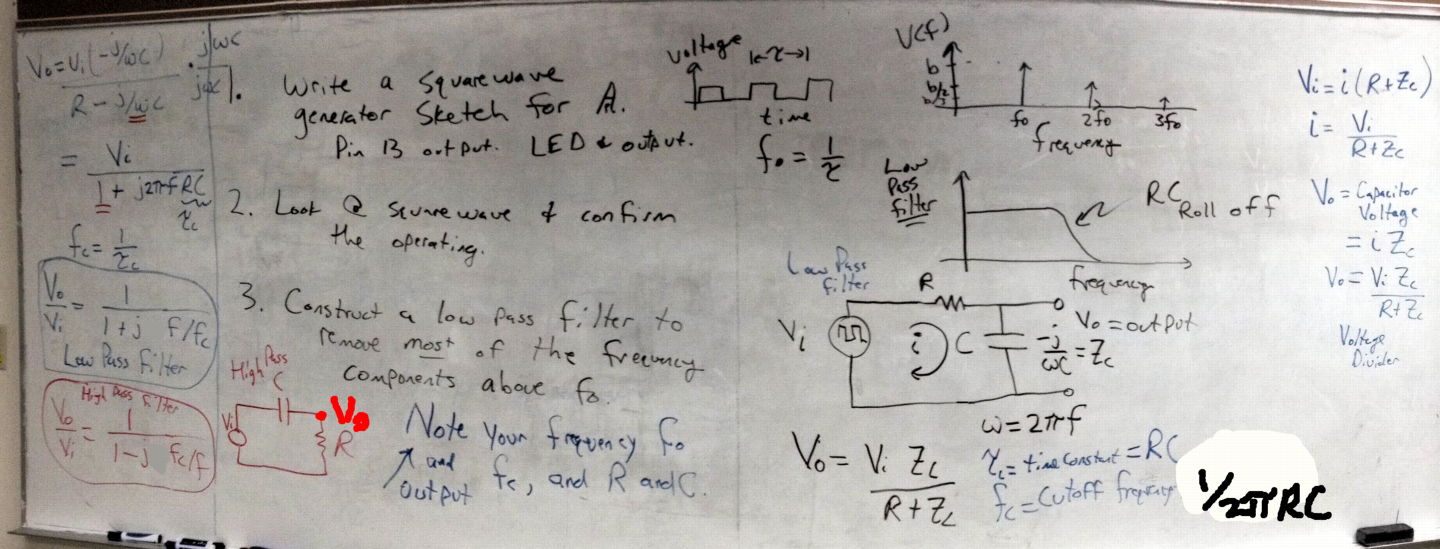
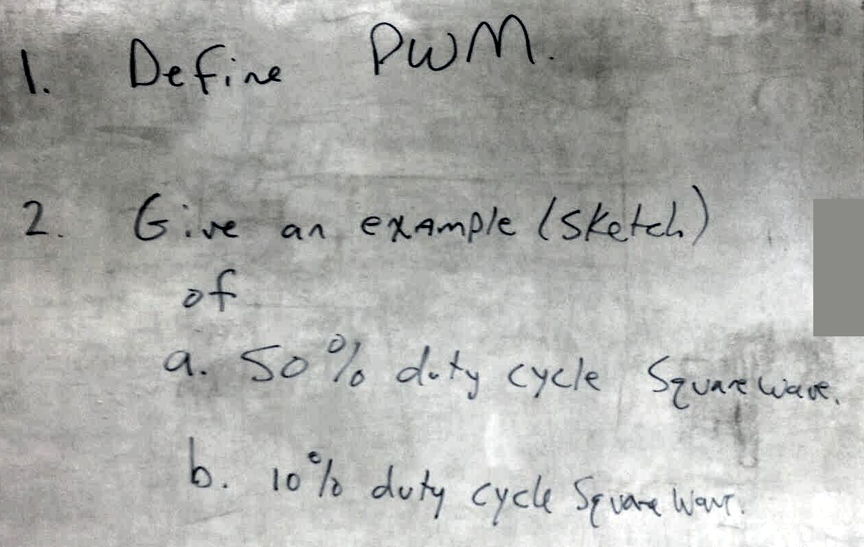
25 Feb class: Quiz, below, and the use of an Arduino as a function generator, plus filtering of the square wave using an RC filter.
RC Filter Calculator using Excel (complex numbers in Excel do work).
Class 27 February 2014 (Thursday) including homework assignment and lab description.
Week 5: 17 February
The first lab has been turned in and students are now working on the second period.The due date for the second period was moved up so that the lab is due a week from Tuesday.
1. Titles. Please choose a title that emphasizes the science achieved rather than the details of the measurements or measurement method.
2. All figures MUST be referenced and discussed in the text.
3. Try to find references that discuss aspects of your lab, both in discussing the nature of the lab as well as interpretative measurements to compare with yours.
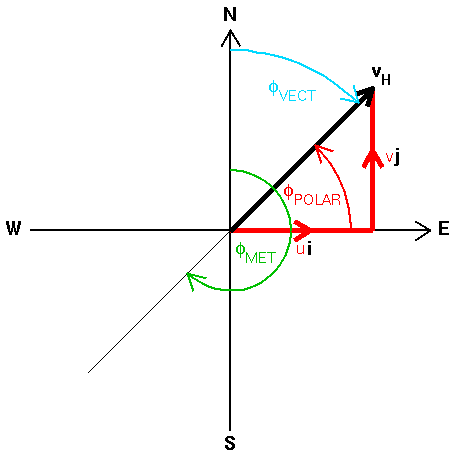
4. The air motions lab ultrasonic anemometer may have the 'u' component of wind positive when coming from the east (rather than west as is usual.) Investigate by comparing with the UNR weather station. The wind coordinate direction is at http://tornado.sfsu.edu/geosciences/classes/m430/Wind/WindDirection.html. It is reproduced here from that article.
I strongly recommend using the writing center at UNR, especially if English is a second language for you. Make an appointment with their staff members to have them evaluate your draft lab report.
Electronics Section: The homework assignment on evaluating the transimpedance amplifier is due on Tuesday. We will continue to work with opamps and detection of light this week, and will use the Arduinos as function generators as a way to become familiar with them. Our goal is to keep working with opamps and photodiodes until we establish a strong foundation.
We will start a new lab on use of the Arduino to become familiar with some of the things it can do, thanks to Ben Sumlin.
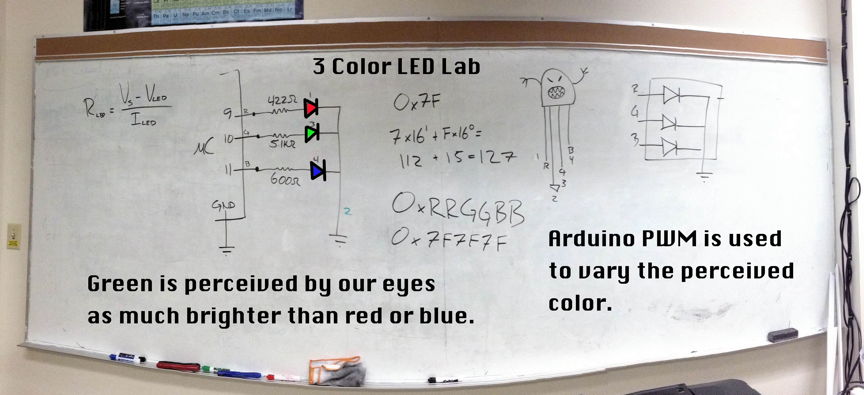
The lab explores color mixtures of an LED that emits red, green, and blue light to demonstrate both the pulse width modulation capability of the Arduino and how colors are represented.
Tuesday's class: worked through the parallel combination of a capacitor and resistor; used it to solve the low pass filter problem associated with the transimpedance amplifier.
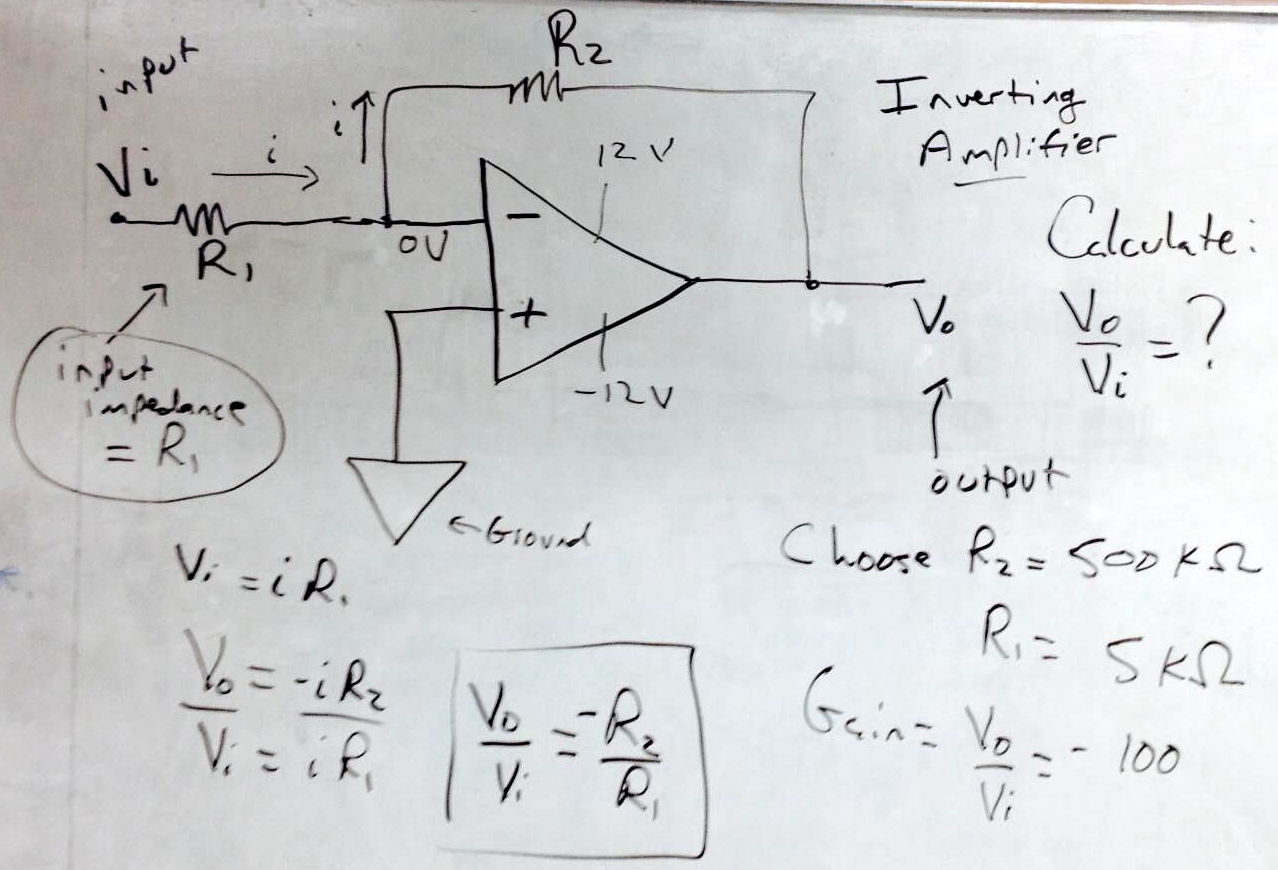
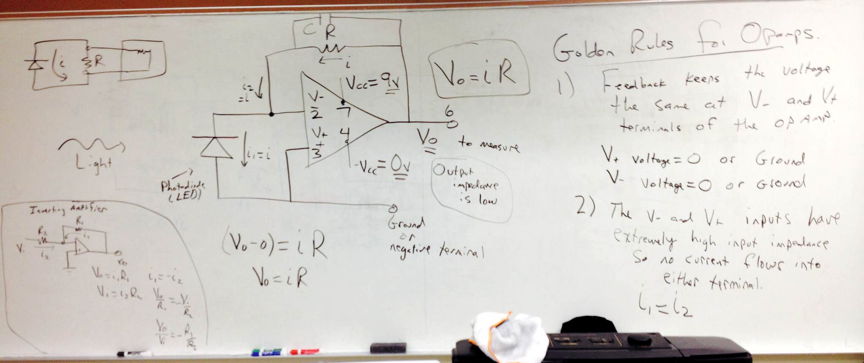
Used the golden rules of the op amp to evaluate the inverting amplifier function of the op amp.
Week 4: 10 February
The first lab has been turned in and students are now working on the second period. Tuesday looks like it will be partly cloudy, an excellent data to get data from most sensors.
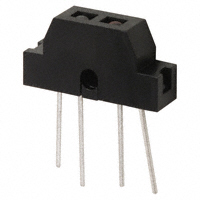
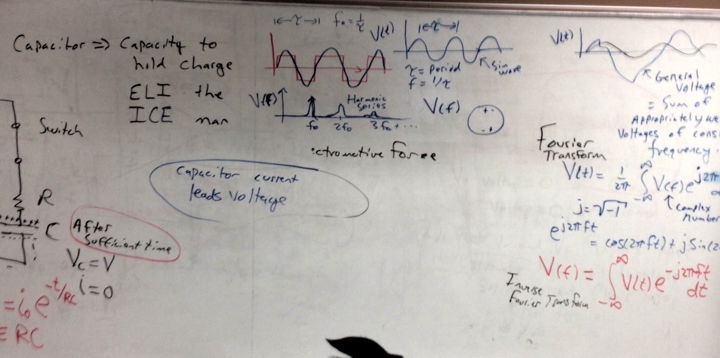
Electronics Section: will work with circuit board layout software for the transimpedance amplifier circuit, and will begin work with the digital light sensor, making use of a voltage regulator to convert from 9 volts to 5 volts DC. We will also cover the theory for a low pass filter, and discuss Fourier analysis use in electronics.
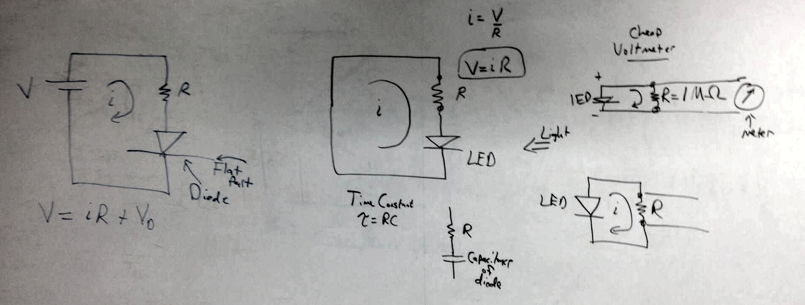
READ THIS AFTER WATCHING THE SOLAR CELLS VIDEO BELOW: How photodiodes work
Tutorial on how solar cells work.
Basic circuit analysis of capacitors.
Light to frequency converter data sheet.
Notes from 13 Feb 2014, and homework assignment for the electronics section.
Week 3: 3 February
The first lab is due on Thursday for the Atmospheric section. Students should work together to get their papers written for this lab.
Bring questions to class on Tuesday. On Thursday we will discuss the labs, and then make the next lab assignments.-Electronics Section: Works with light detectors, operational amplifiers, circuit board layout software.
We will cover the golden rules of opamps and how to easily analyze op amp circuits.
Week 2: 27 January
It's cloud outside on Tuesday. Groups b and c should get measurements. Groups a, d, and e should work together to analyze and finalize their data as much as possible. Begin formulating your paper ideas for the first laboratory assignment.
Electronics Section:
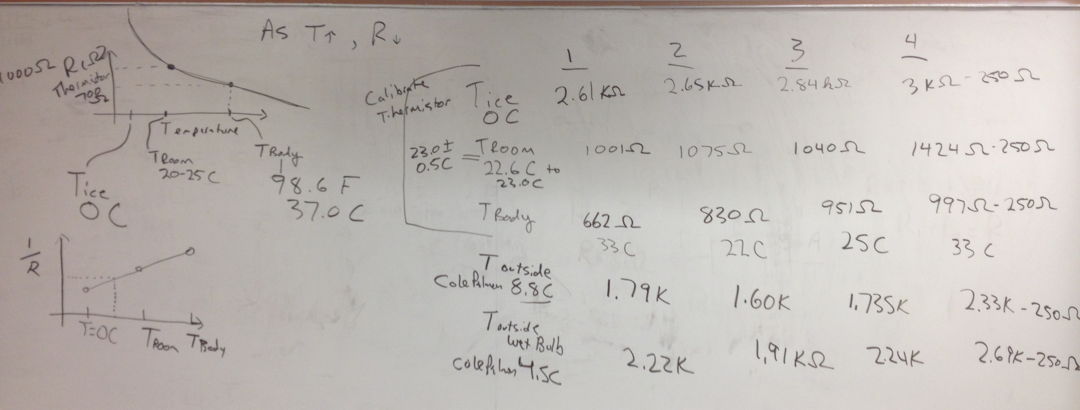
Tuesday: Quiz, studied use of breadboards; studied and did measurements for calibrating thermistors; did dry and wet bulb measurements outside.
Week 1: 20 January
Three places to learn about what is going on in this class:
Daily Notes (here).
Calendar.
Homework.
Syllabus. (see homework for the notebook description).
Period 5
Group 1: Marce, Jayne and Addison
Group 2: Ben and Philip
Group 3: Anna and Maritza
Group 4: Kerwin and Lan
Group 5: Keith and Gustavoa) Air Motions: Click here for data. Use the ultrasonic anemometer to characterize the winds on the top of the Physics building. Compare with the UNR weather station, DRI, and Galena weather stations.
See presentation 1, presentation 2.
See atmospheric boundary layer discussion.
Brochure for our instrument.
Manual for our instrument.
Labview VI for our instrument.b) Sunphotometer: Become familiar with AERONET and the UNR Cimel sunphotometer. Compare retrieved aerosol optical depth with satellite retrievals from NASA MODIS as time permits. Use the two spectrometer system to measure direct and diffuse spectral radiation in the atmosphere as a function of air mass and compare the retrieved aerosol optical depth with the Cimel aerosol optical depth. Observe and compute the ozone spectrum and remove its effect from the AOD. Note added on 15 Feb 2014: The primary goal of this lab is to use the spectrometers to record total and diffuse radiation and to discuss their nature. One spectrometer measures mostly the visible spectrum while the other two measure the UV and near IR spectrum. Explore the dependece of the total and diffuse radiation on wavelength, and discuss your results. Note that the spectrometers are not absolutely calibrated; the spectrum is reported in units of 'counts'. Find the integration time in the file and divide the counts by the integration time so that the 'y axis' is in units of 'counts per second'. Ask if you have questions about what to do.
AERONET presentation.
UNR AERONET station data.
Solar spectrum at top of the atmosphere.
Sunphotometer lecture notes.
Download 'SMARTS' and simulate the diffuse to direct ratio for different aerosol loadings (from none to some) and compare with your measurements of the same.
c) Surface albedo measurements for different surfaces using the two spectrometer based system. Interpret. Measure snow albedo as weather permits. Measure albedo of brown and green pine needles and interpret how you would use these measurements to do satellite remote sensing of a forest to determine live and dead tree content.
Main Presentation.
Related presentation.
Fortran program used to process the raw data (includes a nifty subroutine that generates a gnuplot script and calls it.)d) FTIR Infrared Spectroscopy of the Atmosphere: Measure and interpret the downwelling IR radiation using our FTIR, using the UNR weather station IR sensor output, and using hand held thermometers and the infrared camera for measurements.
Main Presentation.
Related presentation.
We will also use the FLIR i7 infrared camera for cloud base temperature. Example files. Software to view and manipulate the images can be downloaded here.
Have Narayan or me calculate the clear sky radiance for your day, using the line by line radiative transfer model (LBLRTM). Then you can diagnose aerosol and/or cloud impacts on the downwelling IR.e) In Situ Photoacoustic Measurements of Aerosol Light Scattering And Absorption: Measure gaseous and particle air pollution in the Reno boundary layer (where we live). Air pollution during heavy inversions? Properties of 'fresh' and 'aged' air pollution? Aerosol size as a function of the time of day? Air pollution during fire events? Effects of aerosol on boundary layer dynamics due to effects on solar forcing?
Click here for data.
Basic instrument description paper.
Dual wavelength instrument description and use for wood smoke measurements paper.
Reno summer fire weather paper.
Reno winter time inversion paper.
Presentation showing use of instrument for measuring smoke from fires in summer 2013.
Our paper on the relationship between photoacoustic measurements of aerosol light absorption and the filter-based method treatment of light absorption and black carbon mass concentration.LECTURE/LABS
f) Weather Radar: National Weather Service NEXRAD radar.
Radar basics.
Radar and storms.g) Soundings: Purpose - 1. Compare balloon soundings with model soundings, (and others) 2. Compare precipitable water from model with measurements. 3. Compare precipitable water with IR thermometer measurements. 4. Plot 3D time and height graphs for the vertical distribution of density, RH, temperature, wind, etc, from data obtained from the model soundings. Develop/use Matlab code.
Radiosonde presentation.PROPOSED SECOND SECTION OF THE COURSE FOR THOSE INTERESTED IN ELECTRONICS AND INSTRUMENT DEVELOPMENT
PLEASE GO TO THE SURVEY PAGE AND ENTER THE TIMES THAT WORK FOR YOU.
Notes from the first week.
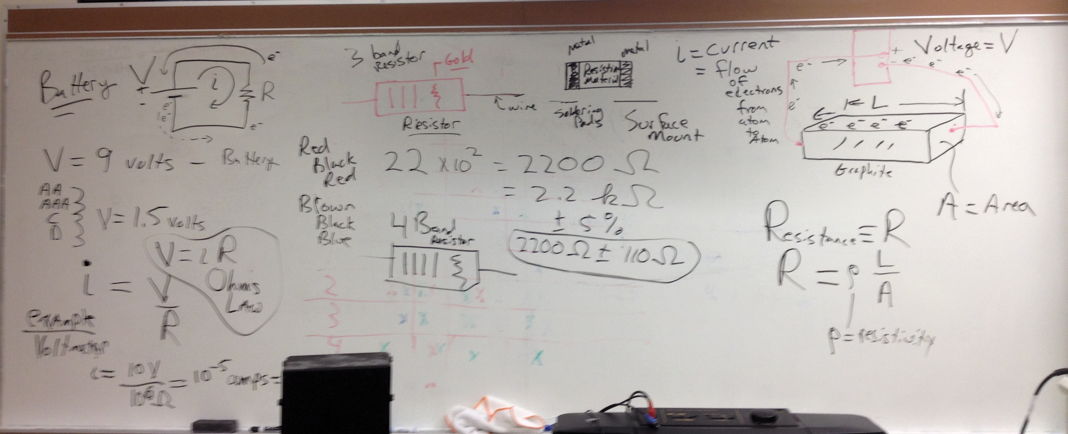
aa) Basic Circuits Laboratory: Purpose - Nearly all instruments use electronics and electronic circuits. Basic familiarity with circuits can be helpful for understanding and diagnosing instrument performance. Instrument development often has a huge component associated with circuits.
We will do a basic circuit laboratory together. (see homework for the reading assignment).
Resistor Color Code.
Basic operational amplifier theory.
Thermistors.bb) Instrument Development: Develop sensors for use on the Mechanical Engineering Dept ultrahigh balloon sounding system, sensors such as particle, trace gas, pressure, temperature, RH, etc, and all. 6 lbs max payload weight. Uses Arduinos (and other) microcontrollers and small, compact systems
ALL WILL WORK TOGETHER FOR A COMMON PURPOSE: To study the atmosphere from many perspectives!
