Weeks 15 and 16: 3 May and 10 May
Assignment 10 has been posted. It will be accomplished mostly in class.
Presentations for Assignment 10 will be on the day of the final exam, May 10th, from 7:30 a.m. to 9:30 a.m.
| Student | Year for Assignment 10 Wave Cloud Study |
| Ann | 2020 |
| Ally | 2021 |
| Octavia | 2019 |
| Sage | 2018 |
| Sony | 2017 |
| Lauren | 2016 |
| Matt | 2015 |
| Zach | 2014 |
| Jackson | 2013 |
| Jessica | 2012 |
| Edward | 2011 |
Photograph of a wavecloud from the top of the Physics building at UNR on the 7th of April 2021 at around 4 pm local time.
Photograph by Ally of the same cloud earlier in the day.
Satellite imagery of the wave clouds on the 7th of April 2021. Faster and longer duration version.
Sounding for the 7th of April 2021 at 12Z.
Sad sounding for the 8th of April 2021 at 0Z.
NOAA Weather and Climate Toolkit for obtaining radar data and satellite imagery.
Afternoon NASA/AQUA/MODIS satellite imagery for the southwest US for April 17th, 2003-2021 to show regularity of the events.
GOES satellite imagery for 11/25/2020 LST showing wave clouds.
Low resolution and high resolution soundings for 0z 11/26/2020.
Radiosonde discussion.
Balloon-based sounding presentation.
Formation of gravity waves in the atmosphere and associated clouds (slides 6-28).
Weeks 13 & 14: 19 April and 26 April
Assignment 10 has been posted. It will be accomplished mostly in class.
Presentations for Assignment 10 will be on the day of the final exam, May 10th, from 7:30 a.m. to 9:30 a.m.
We will work on this assignment in class.
We will begin student presentations of assignment 9 on Monday 19 April 2021, continuing on Monday 26 April 2021.
Please send me the date and time of your study through email on webCampus if you haven't done so.
| Student | Day and Time LST | Year for Assignment 10 Wave Cloud Study |
| Ann | 1/1/21 5:30 | 2020 |
| Ally | 1/4/21 0:30 | 2021 |
| Octavia | 1/4/21 08:00 | 2019 |
| Sage | 1/6/21 13:30 | 2018 |
| Sony | 1/8/21 6:00 | 2017 |
| Lauren | 1/12/21 17:30 | 2016 |
| Matt | 1/15/21 15:30 | 2015 |
| Zach | 1/21/21 10:30 | 2014 |
| Jackson | 1/23/21 06:00 | 2013 |
| Jessica | 1/26/21 15:30 | 2012 |
| Edward | 1/30/21 18:30 | 2011 |
| Unavailable | 1/27/21 18:00:00 - 1/28/2021 03:30:00 | |
| Unavailable | 1/28/21 7:30 |
Related topic, aerosol air pollution measurements made from the top of the Physics building.
SPS30 Application note and description of measurement method.
GOES Geostationary satellite data loop for the January 19th case study.
Upcoming:
Photograph of a wavecloud from the top of the Physics building at UNR on the 7th of April 2021 at around 4 pm local time.
Photograph by Ally of the same cloud earlier in the day.
Satellite imagery of the wave clouds on the 7th of April 2021. Faster and longer duration version.
Sounding for the 7th of April 2021 at 12Z.
Sad sounding for the 8th of April 2021 at 0Z.
NOAA Weather and Climate Toolkit for obtaining radar data and satellite imagery.
Afternoon NASA/AQUA/MODIS satellite imagery for the southwest US for April 17th, 2003-2021 to show regularity of the events.
GOES satellite imagery for 11/25/2020 LST showing wave clouds.
Low resolution and high resolution soundings for 0z 11/26/2020.
Radiosonde discussion.
Balloon-based sounding presentation.
Formation of gravity waves in the atmosphere and associated clouds (slides 6-28).
Week 12: 12 April
We will begin student presentations of this assignment on Monday 19 April 2021.
Friday: Bring questions to class about your case study, or the January 19th case study, etc.
Monday notes about Cimel sunphotometer data.
We will continue homework 9, aerosol and meteorology case study.
Add to the 'Methods' section after we have discussed instruments.
Add to the results section after we've discussed and developed graphics.
Discuss the Cimel sunphotometer and sunphotometery in general: Presentation, and discussion.
Get the aerosol optical depth for January 19, and the size distribution retrievals.
Interpret the times when the spectral AOD is about the same for each wavelength due to dust aerosol size.
Begin discussion and use of HYSPLIT back trajectory analysis. Presentation.
Do the HYSPLIT back trajectory analysis for January 19th (install Google Earth to make the graphics for the back trajectory analysis.)
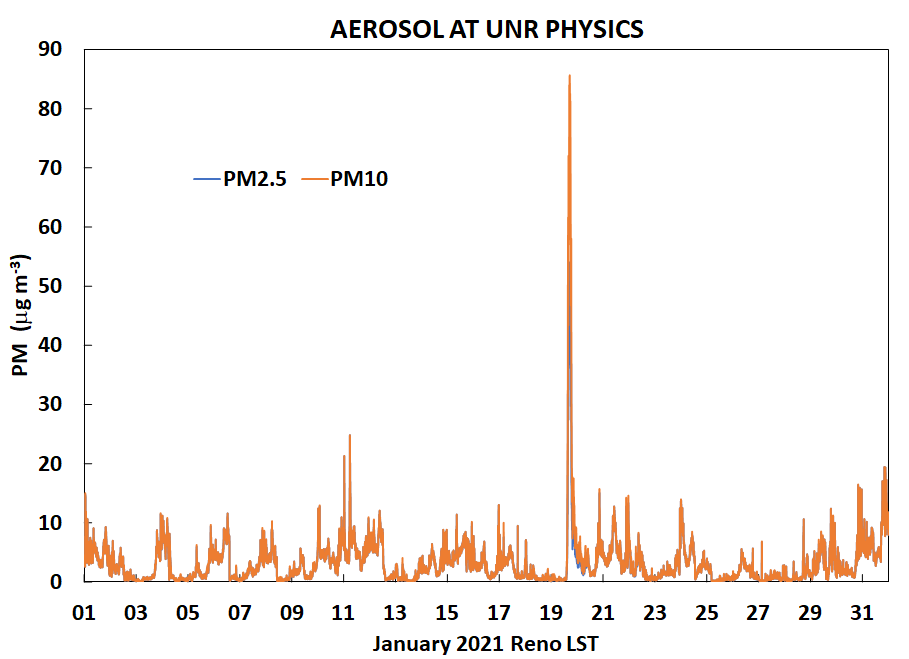
For those who haven't done so yet, review the PM2.5 time series for January 2021 and choose a particular time for in depth study as we are doing for January 19th in class.
You can use the time series of PM measurements we made for the entire month to be specific.
The times chosen so far are these:
| Student | Day and Time LST |
| Ann | 1/1/21 5:30 |
| Ally | 1/4/21 0:30 |
| Octavia | 1/4/21 08:00 |
| Sage | 1/6/21 13:30 |
| Sony | 1/8/21 6:00 |
| Lauren | 1/12/21 17:30 |
| Matt | 1/15/21 15:30 |
| Zach | 1/21/21 10:30 |
| Jessica | 1/26/21 15:30 |
| Edward | 1/30/21 18:30 |
| Unavailable | 1/27/21 18:00:00 - 1/28/2021 03:30:00 |
| Unavailable | 1/28/21 7:30 |
Related topic, aerosol air pollution measurements made from the top of the Physics building.
SPS30 Application note and description of measurement method.
Lapse rate effects on smoke plume rise, and example of long range transport of smoke from Russian fires to the US.
Week 11: 5 April
We will continue homework 9, aerosol and meteorology case study.
Add to the 'Methods' section after we have discussed instruments.
Add to the results section after we've discussed and developed graphics.
Monday and Wednesday:
SPS30 PM2.5 wind direction bubble plot: Highlight the time interval studies and wind vectoring of air pollution transport.
Scatter plot of SPS30 PM2.5 and sonic wind speed. Does wind speed explain air pollution amounts?
Friday:
Discuss the Cimel sunphotometer and sunphotometery in general: Presentation, and discussion.
Get the aerosol optical depth for January 19, and the size distribution retrievals.
Interpret the times when the spectral AOD is about the same for each wavelength due to dust aerosol size.
Begin discussion and use of HYSPLIT back trajectory analysis. Presentation.
For those who haven't done so yet, review the PM2.5 time series for January 2021 and choose a particular time for in depth study as we are doing for January 19th in class.
You can use the time series of PM measurements we made for the entire month to be specific.
The times chosen so far are these:
| Student | Day and Time LST |
| Ann | 1/1/21 5:30 |
| Ally | 1/4/21 0:30 |
| Octavia | 1/4/21 08:00 |
| Sage | 1/6/21 13:30 |
| Sony | 1/8/21 6:00 |
| Lauren | 1/12/21 17:30 |
| Matt | 1/15/21 15:30 |
| Zach | 1/21/21 10:30 |
| Jackson | 1/23/21 06:00 |
| Edward | 1/30/21 18:30 |
| Unavailable | 1/27/21 18:00:00 - 1/28/2021 03:30:00 |
| Unavailable | 1/28/21 7:30 |
Related topic, aerosol air pollution measurements made from the top of the Physics building.
New and Important: SPS30 Application note and description of measurement method.
Lapse rate effects on smoke plume rise, and example of long range transport of smoke from Russian fires to the US.
Week 10: 29 March
Continue working on homework 9, aerosol case study.
Be working on the report for this assignment, especially the 'Methods' section where you describe the instruments that are being used.
Wednesday:
Prepare scatter plot of BAM and SPS30 data. Sort data to look at the main body of the data. Trend line discussion. Does the SPS30 data 'agree' with the BAM PM2.5 measurements?
SPS30 PM2.5 wind direction bubble plot: Highlight the time interval studies and wind vectoring of air pollution transport. Format data series to see bubble options.
Scatter plot of SPS30 PM2.5 and sonic wind speed. Does wind speed explain air pollution amounts?
Monday:
Read in the 1 minute time averaged SPS30 data.
Time align it to the Sonic anemometer data.
Read in the SPS30 data that has been
time averaged to match the BAM data (remove the first row of the BAM data since it's for December).
Prepare time series and scatter plot comparisons of the BAM and SPS30 data.
Friday:
Talk about the Cimel sunphotometer and sunphotometery in general.
Get the aerosol optical depth for January 19, and the size distribution retrievals.
Begin discussion and use of HYSPLIT back trajectory analysis.
Review the PM2.5 time series for January 2021 and tentatively choose a particular time for in depth study as we will be doing for January 19th in class.
We will look closely at this data in class too. You can read in the SPS30 data and make a time series of PM2.5 like this.
Related topic, aerosol air pollution measurements made from the top of the Physics building.
New and Important: SPS30 Application note and description of measurement method.
Week 9: 22 March
Continue working on homework 9, aerosol case study.
Be working on the report for this assignment, especially the 'Methods' section where you describe the instruments that are being used.
Monday: Work with the BAM data
to scope the month, looking at all of the events that happened, especially on the 19th of January.
Discuss the SPS30 low cost air quality sensor.
Wednesday: No class, reading day.
Review the PM2.5 time series for January 2021 and tentatively choose a particular time for in depth study as we will be doing for January 19th in class.
We will look closely at this data in class too. You can read in the SPS30 data and make a time series of PM2.5 like this.
Related topic, aerosol air pollution measurements made from the top of the Physics building.
Citizen science aerosol pollution measurement network based on low cost air quality sensors.
Week 8: 15 March
Continue working on homework 9, aerosol case study. Read in the sonic anemometer data for Monday.
Review the PM2.5 time series for January 2021 and tentatively choose a particular time for in depth study as we will be doing for January 19th in class.
We will look closely at this data in class too. You can read in the SPS30 data and make a time series of PM2.5 like this.
Review turbulent kinetic energy obtainable using sonic anemometer measurements.
Review radioactive carbon 14 in relation to the Beta Attenuation (BAM) instrument we will be discussing.
Related topic, aerosol air pollution measurements made from the top of the Physics building.
EPA Criteria Air Pollutants and National Air Quality Standards.
Citizen science aerosol pollution measurement network.
Week 7: 8 March
Begin working on homework 9, aerosol case studies.
Wednesday is a reading day, no class.
Related topic, aerosol air pollution measurements made from the top of the Physics building.
Week 6: 1 March
Students volunteer to share their diurnally averaged data for August 2020, and bring questions to class.
Continue with assignment 7 on use of temperature measurements in our area to diagnose atmospheric stability.
Make the additional diurnal plots for February 2020. Example diurnal plot.
Demonstrate the web of science for finding references, and putting them in EndNote online, and use of the Endnote plugin for Microsoft Word to manage your references.
Reno as a valley subject to cold pools.
Lapse rate definition.
Begin discussing homework 8.
Related topic, aerosol air pollution measurements made from the top of the Physics building.
Presentation on thermistor temperature sensors as a commonly used type of sensor.
Aerosol mass concentration (PM2.5) for Reno in 2020 as an image and spreadsheet.
Week 5: 22 February
Continue with assignment 7 on use of temperature measurements in our area to diagnose atmospheric stability.
Do the 24 hr average analysis for the meteorological variables.
Reno as a valley subject to cold pools.
Lapse rate definition.
Related topic, aerosol air pollution measurements made from the top of the Physics building.
Presentation on thermistor temperature sensors as a commonly used type of sensor.
Aerosol mass concentration (PM2.5) for Reno in 2020 as an image and spreadsheet.
Week 4: 15 February
Continue with assignment 7 on use of temperature measurements in our area to diagnose atmospheric stability.
Reno as a valley subject to cold pools.
Lapse rate definition.
Notes for assignment 7 (OneNote format).
Related topic, aerosol air pollution measurements made from the top of the Physics building.
Presentation on thermistor temperature sensors as a commonly used type of sensor.
Aerosol mass concentration (PM2.5) for Reno in 2020 as an image and spreadsheet.
Week 3: 8 February
Assignments.
Continue with assignment 6 on weather radar observations.
National Weather Service radar website.
Begin assignment 7 on use of temperature measurements in our area to diagnose atmospheric stability.
Be sure that you're ready to go with Excel. We will be using data from the UNR and DRI weather stations.
We will start with a discussion of weather stations and about 'lapse rate and stability'.
Related topic, aerosol air pollution measurements made from the top of the Physics building;
use Google Earth to illustrate the location of the Reno weather balloon launch facility in relation to the valley floor (what part of the atmosphere is missed by the weather balloon data).
Example morning atmospheric sounding for Reno. Soundings from the Univ of Wyoming site.
Presentation on thermistor temperature sensors as a commonly used type of sensor.
Aerosol mass concentration (PM2.5) for Reno in 2020 as an image and spreadsheet.
Reminder of Required and Recommended Software:
1. Zoom online class interface.
2. Excel and Word. Available for students and faculty here. Sign in with your UNR netID and download Office to your computer. We will import data using the text wizard: Excel:File:Options, then check this box.
3. Google Earth available here.
4. Anaconda distribution of Python available here. We may use 'Spider' to edit and run Python programs.
5. You can use Matlab or any other program if you want, for data and graphical analysis, in addition to using Excel.
Invitation to participate in the UNR Meteorology Club Meetings Mondays at noon.
Climate update for our region.
Week 2: 1 February
Assignments.
Assignment 6 on weather radar observations.
Weather radar presentation as powerpoint and as a pdf document for understanding radar and dbZ.
Reminder of Required and Recommended Software:
1. Zoom online class interface.
2. Excel and Word. Available for students and faculty here. Sign in with your UNR netID and download Office to your computer. We will import data using the text wizard: Excel:File:Options, then check this box.
3. Google Earth available here.
4. Anaconda distribution of Python available here. We may use 'Spider' to edit and run Python programs.
5. You can use Matlab or any other program if you want, for data and graphical analysis, in addition to using Excel.
Invitation to participate in the UNR Meteorology Club Meetings Mondays at noon.
Climate update for our region.
Week 1: 25 January
Monday Class:
Introductions and orientation.
Places to learn about what is going on in this class:
Daily Notes (here).
Calendar.
Assignments.
Assignment 1-5 have been posted. Review all assignments.
Syllabus.
Webcampus.
Required and Recommended Software:
1. Zoom online class interface.
2. Excel and Word. Available for students and faculty here. Sign in with your UNR netID and download Office to your computer. We will import data using the text wizard: Excel:File:Options, then check this box.
3. Google Earth available here.
4. Anaconda distribution of Python available here. We may use 'Spider' to edit and run Python programs.
5. You can use Matlab or any other program if you want, for data and graphical analysis, in addition to using Excel.
Atmospheric Instruments used at the DOE ARM meteorological/climate studies sites.
Meaurement uncertainty and local backup.
How to keep a lab notebook to record what you do and help in lab report writing.
a. Make a table of contents at the back.
b. Number the pages so you can add entries to the table of content.
Discussion of lab notebooking from CU.